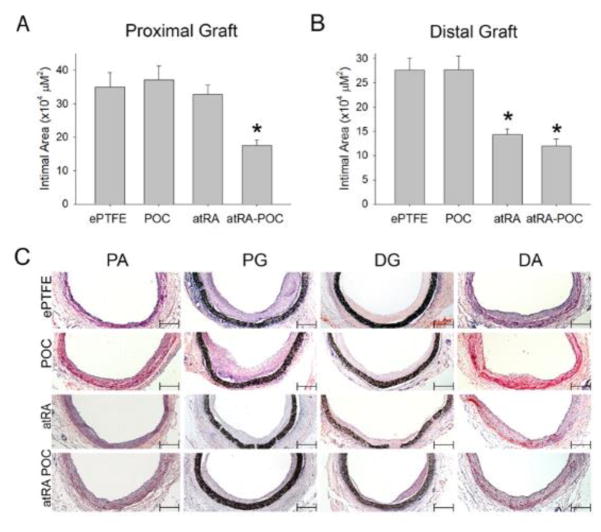
Figure 5. Grafts containing atRA exhibited decreased intimal area at the proximal and distal ends of the graft.
(A–B) Quantification of the intimal area at the (A) proximal graft (PG) and (B) distal graft (DG). (C) Representative cross sections used to perform morphometric analysis for each graft and region. Data expressed as mean ± SE, represents 5–6 sections at each region for each rat (n=6–7/treatment group), analysis via one-way ANOVA. *P < 0.05 versus ePTFE. Scale bar = 50 μm, original magnification = x 2.5. PG: proximal graft, DG: distal graft, ePTFE: extended polytetrafluroethylene, POC-ePTFE: poly(1,8 octamethylene citrate) ePTFE, atRA-ePTFE: all-trans retinoic acid-coated ePTFE, and atRA-POC-ePTFE: all-trans retinoic acid- poly(1,8 octamethylene citrate) ePTFE.

