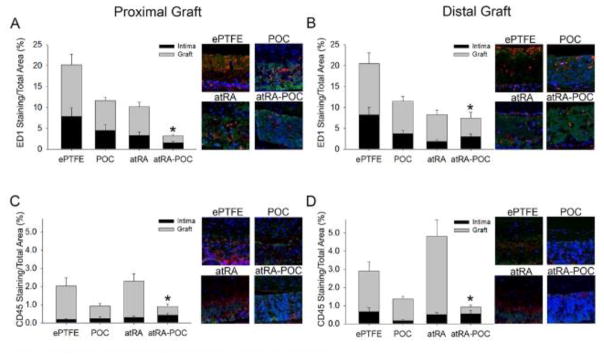
Figure 7. atRA-POC-ePTFE grafts exhibited decreased macrophage (ED1) and leukocyte (CD45) infiltration.
(A–D) Representative cross sections and quantification of staining in the intimal and graft layers for: (A–B) ED1 staining (red), and (C–D) CD45 staining (red) at the (A,C) proximal graft and (B,D) distal graft regions. Blue = nuclei stained with DAPI; red = ED1 or CD45 staining; and green = autofluorescence. Data expressed as mean ± SE, represents 4–5 sections at each region for each rat (n=6–7/treatment group), analysis via one-way ANOVA. *P < 0.05 versus ePTFE. Original magnification = x 2.5, quadrants = x 10. PG: proximal graft, DG: distal graft, ePTFE: extended polytetrafluroethylene, POC-ePTFE: poly(1,8 octamethylene citrate) ePTFE, atRA-ePTFE: all-trans retinoic acid-coated ePTFE, and atRA-POC-ePTFE: all-trans retinoic acid- poly(1,8 octamethylene citrate) ePTFE.

