Figure 2.
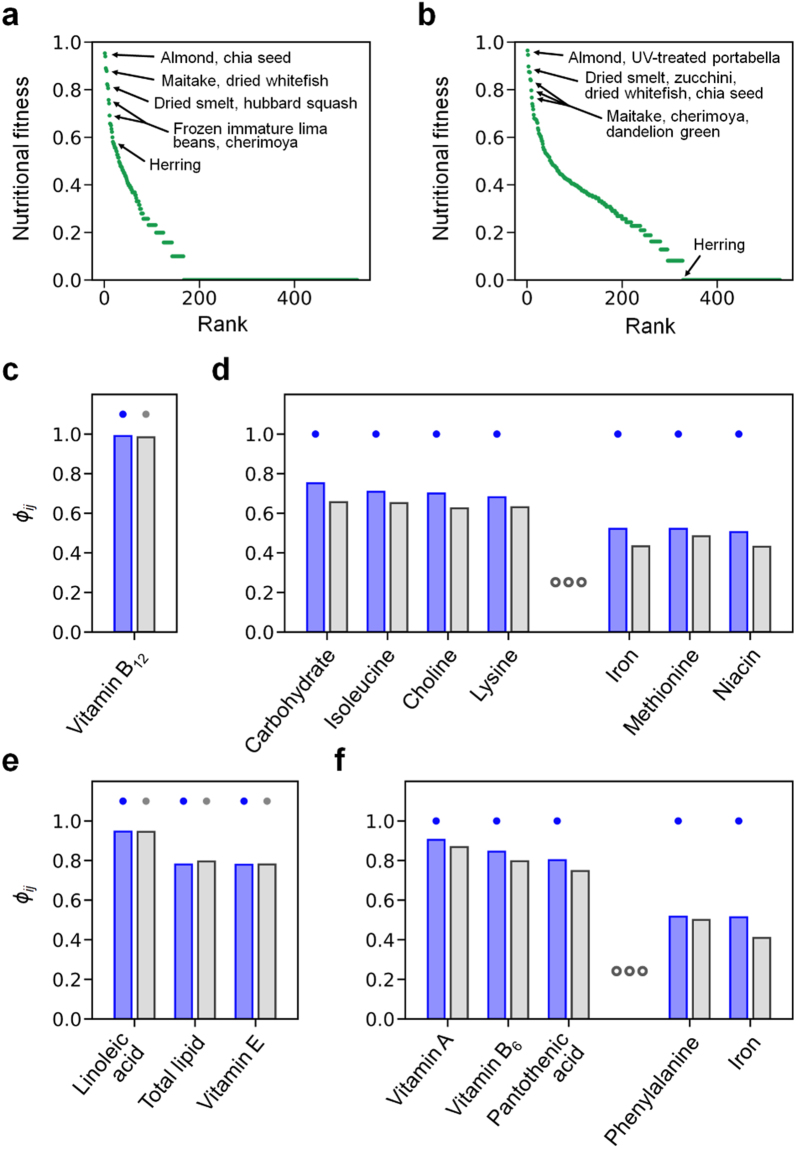
Highly personalised, mainly plant-based diets. We here consider the following two personalised cases: 61-year-old male (case I) and 58-year-old female (case II), who practise a plant-based, methionine-restricted diet, and consume a limited amount of animal products. Cases I and II are different in their physical conditions and specific food intakes, as described in the main text. (a) NFs of foods in case I, sorted in descending order. (b) NFs of foods in case II, sorted in descending order. Given food i and nutrient j, ϕij indicates the contribution of nutrient j to the NF of food i, as described in the main text. The specific value of ϕij depends on cases I and II. From each of the following foods in (c) to (f), ϕij is plotted for the nutrients with ϕij > 0.5 in either case I or II: (c) dried smelt, (d) frozen immature lima beans, (e) almond, and (f) hubbard squash. For each nutrient in (c) to (f), two ϕij values from cases I and II are presented sequentially (case I in blue and case II in grey). In case I or II, if the NF of the food is >0.7, the top of ϕij from that case is dotted. In (d) and (f), some nutrients with intermediate ϕij values are omitted for visual clarity, and all of the data can be found in Supplementary Data S2.

