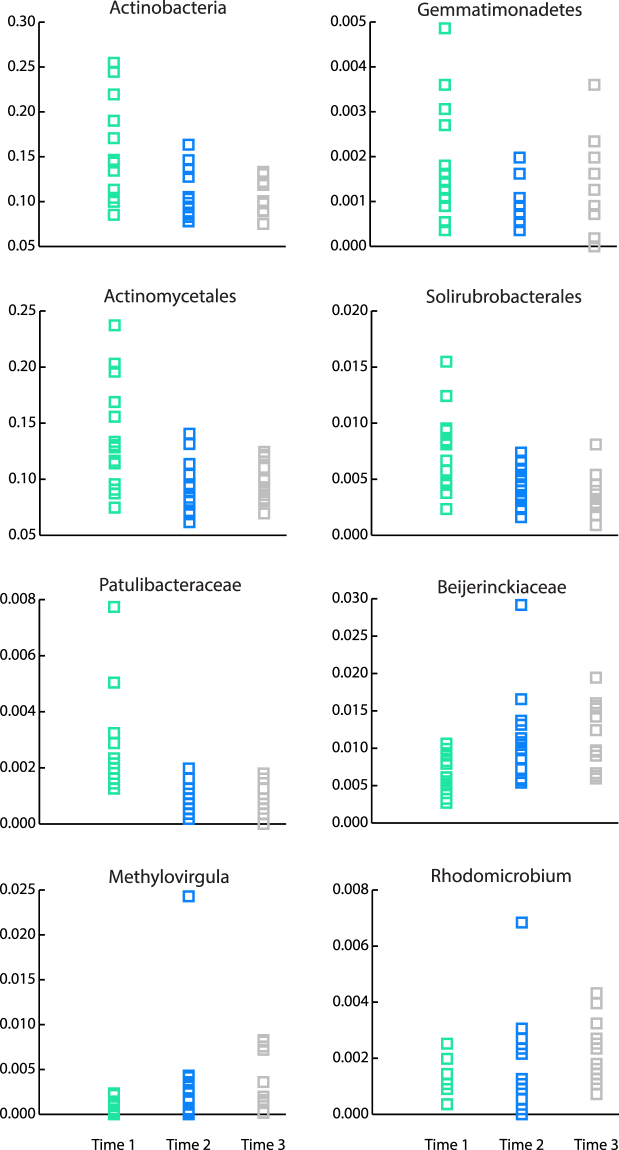
Figure 4.
Relative abundances of bacterial taxa that significantly changed in response to seasonality in precipitation and litterfall in a LTERF. Time 1, green (rainy season); Time 2, blue (transition into dry season); Time 3, grey (dry season). For Gemmatimonadetes identical abundance values were found at all taxonomic levels and therefore only the phylum level figure is shown; for Patulibacteraceae and Patulibacter identical values are represented by Patulibacteraceae.

