
Figure 1.
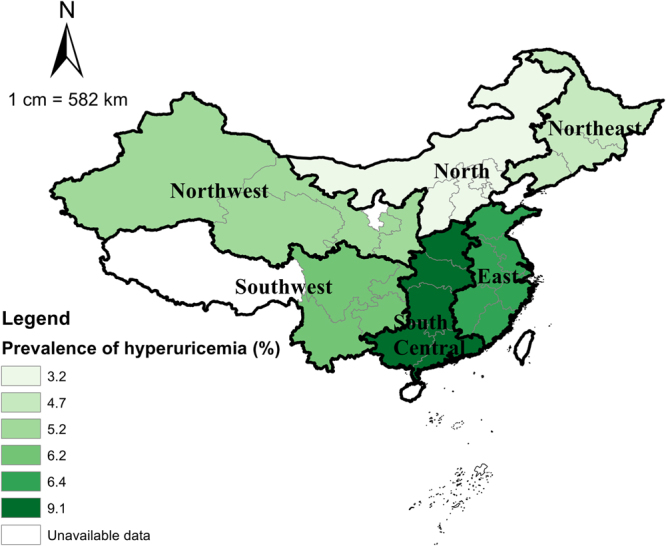
Prevalence of hyperuricemia in the CHARLS 2011 survey, by geographic region. The map was created using ArcMap (version 10.1, ESRI Inc. Redlands, CA, USA. https://www.esri.com/).
Official websites use .gov
A
.gov website belongs to an official
government organization in the United States.
Secure .gov websites use HTTPS
A lock (
) or https:// means you've safely
connected to the .gov website. Share sensitive
information only on official, secure websites.
Prevalence of hyperuricemia in the CHARLS 2011 survey, by geographic region. The map was created using ArcMap (version 10.1, ESRI Inc. Redlands, CA, USA. https://www.esri.com/).