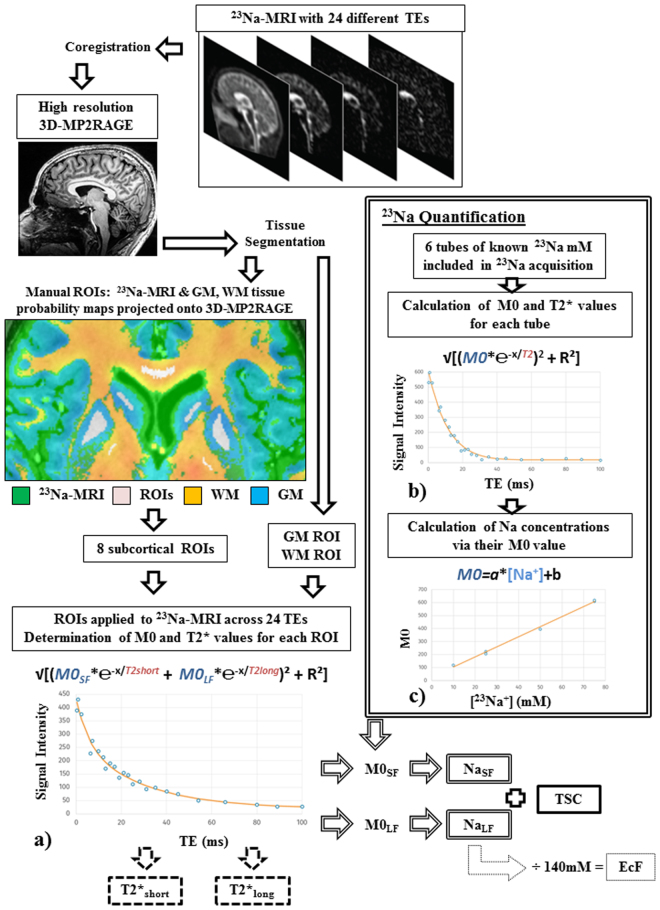
Figure 2.
Schematic workflow of processing procedure applied to data and the six measures obtained. After image post-processing, several fitting procedures were applied to 23Na-MRI data derived from 10 ROIs (examples shown include the caudate, putamen, pallidum and corpus callosum). Fitting included: (a) a biexponential model to obtain estimates of the magnetization (M0SF, M0LF) apparent from the signal fractions associated with short and long T2* components from in vivo ROIs; (b) a monoexponential model to obtain estimates of M0 for each reference tube and (c) a linear model of the relationship between M0 and known reference concentrations. The six output parameters and their derivation are marked: two T2* components (dashed outline), a Na concentration for each component (double outline), TSC (solid outline) and EcF (dotted outline) See text for more details. Abbreviations: TE, echo time; mM, millimolar; ms, milliseconds; ROIs, regions of interest.

