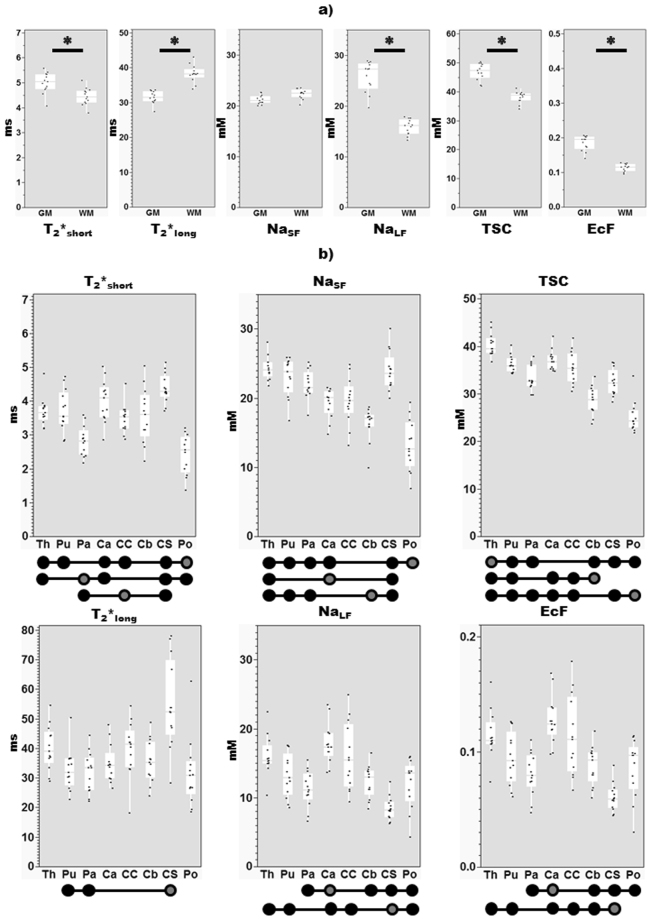
Figure 4.
Post-hoc differences (z, Steel-dwass). Note the y-axis scale differs between parameters. Results of tests applied to (a) data from whole GM, WM masks (Significant differences of P < 0.008 marked with a bar and asterisk), and (b) sub-regions. Due to the number of comparisons between subregions, significant differences at Bonferroni-corrected level between a region (circle with dark grey interior) with other regions (full black circles) are indicated below each graph. Abbreviations: EcF, extracellular fraction; GM, grey matter; mM, millimolar; ms, milliseconds; TSC, total sodium concentrations; WM, white matter; Th, thalamus; Pu, putamen; Pa, pallidum; Ca, caudate; Cc, corpus callosum; Cb, cerebellar WM, Cs, centrum semiovale; Po, pons.

