
Figure 1.
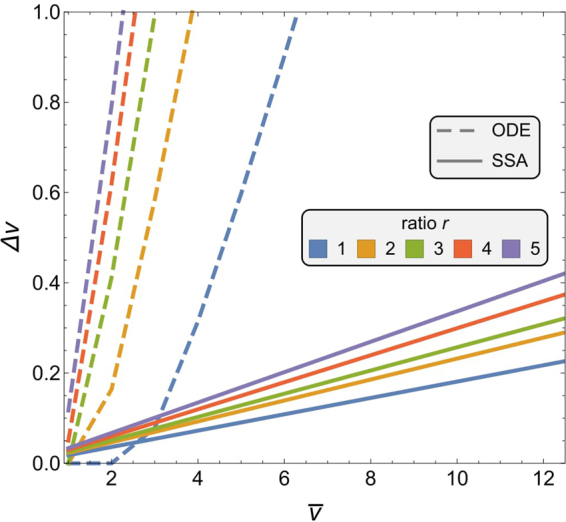
Comparison between analytical results from the ODE system of Eqs (1) and (2) and the computational results from the SSA with system size S = 500, see Sec. 5.1. The analytical lines show the bifurcation from bistability (left side, where noise may lead to inferior option) to a single-attractor phase (right side, where convergence to the superior option is guaranteed)18. The SSA results display the minimum difference for which the model correctly discriminates; this happens in the bistable regime. The SSA lines are fitted through linear regression (Supplementary Table S1).