Figure 2.
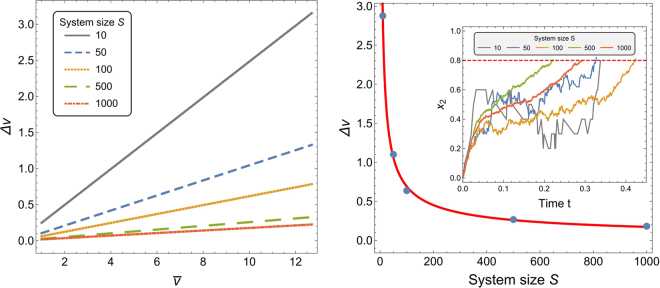
The just noticeable difference Δv increases with the magnitude of random fluctuations. (left) the Weber fraction increases with decreasing system size S (i.e., for increasing random fluctuations), see Supplementary Table S1. (right) Just noticeable difference as a function of S for base quality . The data points are fitted with the red curve (z + aS−b), with a ≈ 12.13, b ≈ 0.626, z ≈ 0.013, and quality of fit R2 > 0.999 (see Sec. 5.4). The inset shows examples of commitment change for v1 = 10, v2 = 11 and varying number of bees S; the largest fluctuations are displayed for S = 10. Plots show results for signalling ratio r = 3.

