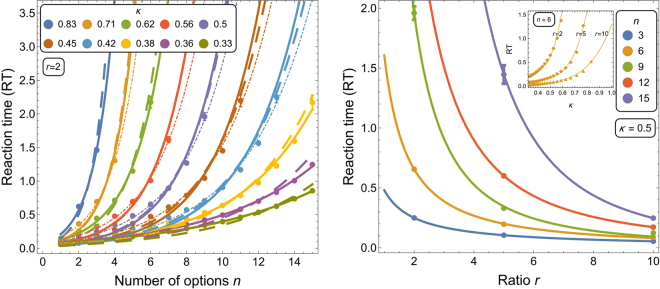
Figure 3.
(Left panel) Mean RT to reach the quorum Q = 0.8 for the best option as a function of the number of options n. Different coloured lines correspond to varying decision difficulty κ (see Sec. 5.2). The SSA data (points) are fitted with curves of Eq. (5) (light dot-dashed lines), with curves of Eq. (7) (solid lines), and with curves of Eq. (7) using fμ(κ) (dashed thick lines) (see Supplementary Table S2). (Right panel) Mean RT decreases as a power law with the signalling ratio r. The SSA data (points) are fitted with the curve . The inset shows a power law increase () of RT as a function of the problem difficulty κ. Vertical bars show the variance.

