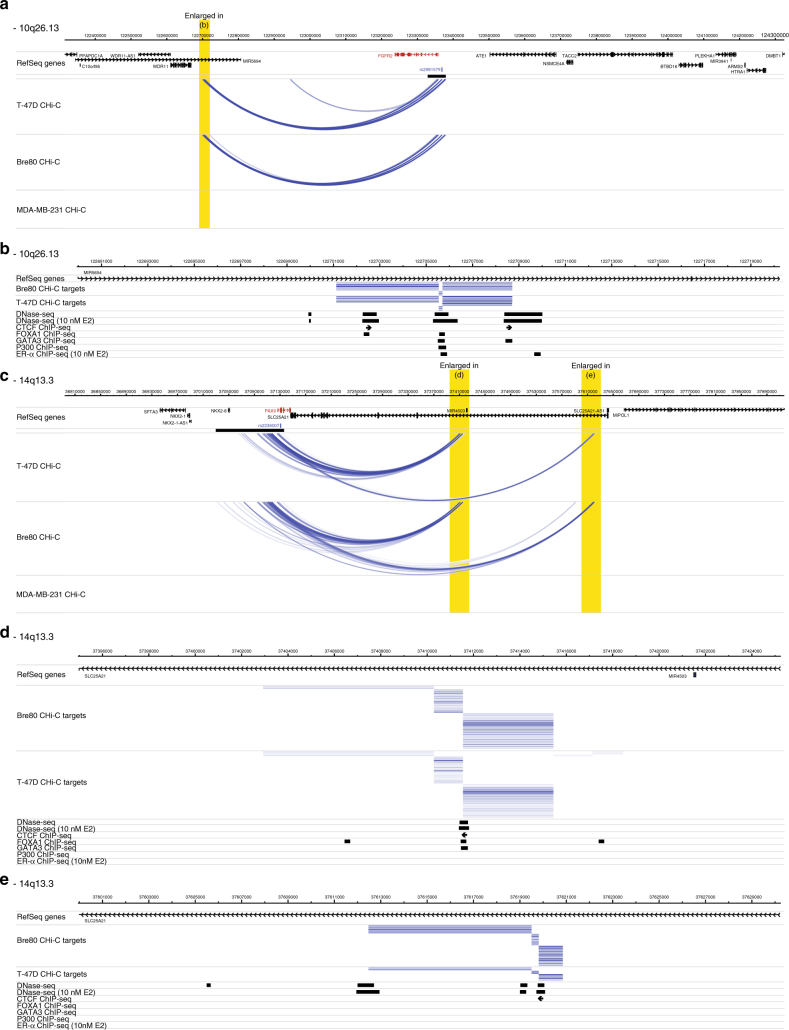
Fig. 2.
Interaction peaks at 10q26.13 and 14q13.3 in T-47D, Bre80 and MDA-MB-231 cell lines. Interaction peaks are shown in a looping format; interaction peaks in ZR-75–1, BT-20 and GM06990 are not shown but are available online (Methods). Interaction peaks between two captured fragments are red, interaction peaks between one captured fragment and one non-captured fragment are blue. Intensity of individual interactions are proportional to -log2(PFDR). Capture regions are shown as black bars; data are aligned with genomic coordinates (hg19) and RefSeq genes. Target genes (i.e. the subset at which an interaction peak co-localises with the TSS) are shown in red. The location of the published risk SNP is also shown. a 10q26.13-rs2981579 (FGFR2) locus. Interaction peaks originating from the capture region and co-localising with the FGFR2 TSS, interact with a region ~650 kb centromeric to the locus (highlighted in yellow) in T-47D and Bre80, but not MDA-MB-231. b Interaction peaks (shown in blue) at this region co-localise with DNase I hypersensitive sites, CTCF, p300, FOXA1, GATA3 and ERα ChIP-Seq peaks in T-47D cells. The orientation of CTCF peaks is indicated by the direction of the arrow. c 14q13.3-rs2236007 (PAX9) locus. Interaction peaks originating from the capture region and co-localising with the PAX9 TSS, interact with two regions ~300 and 500 kb telomeric to the locus (highlighted in yellow) in T-47D and Bre80, but not MDA-MB-231. Scale bar, 80 kb (d) and e Interaction peaks at these regions co-localise with DNase I hypersensitive sites, CTCF, FOXA1 and GATA3 ChIP-Seq peaks in T-47D cells. The orientation of CTCF peaks is indicated by the direction of the arrow

