Fig. 3.
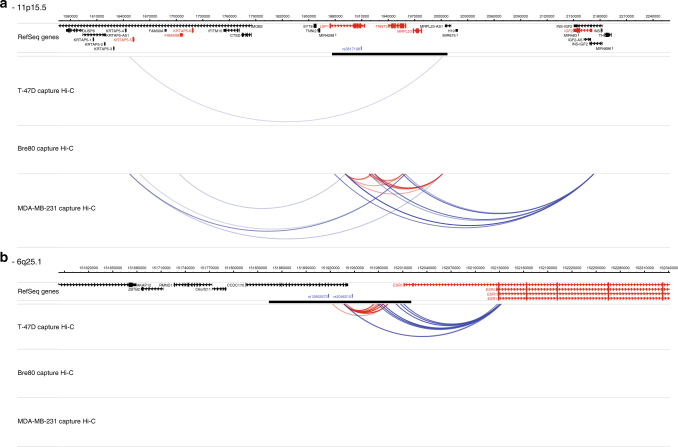
Interaction peaks at 11p15.5 and 6q25.1 in T-47D, Bre80 and MDA-MB-231 cell lines. Interaction peaks and genomic features are as described in Fig. 2. a 11p15.5-rs3817198 (LSP1) locus. At this locus, which is associated with ER+ disease there are multiple interaction peaks targeting KRTAP5-5 (~300 kb centromeric), LSP1 (within the capture region) and IGF2 (~ 250 kb telomeric) in the ER− cell line MDA-MB-231 but just a single IP targeting KRTAP5-5 in the ER+ cell line T-47D and none in Bre80. b 6q25.1-rs2046210 (ESR1) locus. At this locus, which is associated with predominantly ER− disease, there are multiple interaction peaks originating from the capture region, overlapping the ESR1 promoter in the ER+ breast cancer cell line T-47D, but not in the ER− cells breast cancer cell line MDA-MB-231

