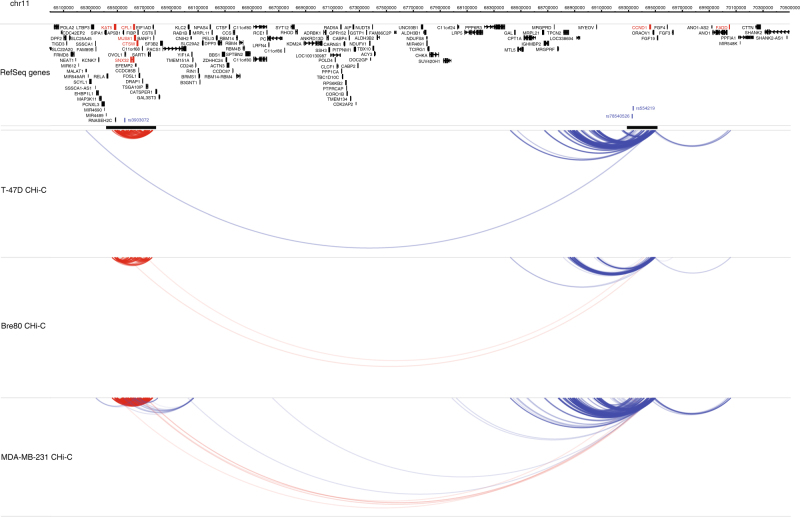
Fig. 4.
Interaction peaks at 11q13.1 and 11q13.3 in T-47D, Bre80 and MDA-MB-231 cell lines. Interaction peaks and genomic features are as described in Figs 2 and 3, with the exception that only target genes that are eQTLs are in red. In addition to the local within capture and in cis interaction peaks at each of these loci there are long-range (>4 Mb) interaction peaks between the two risk loci in both Bre80 and MDA-MB-231 cell lines. Target genes that are eQTLs for the 11q13.1 risk SNP (rs3903072) are CFL1, CTSW, KAT5, MUS81, SNX32, CCND1 and FADD. Three interactions are omitted for clarity (see Methods)

