
Fig. 5.
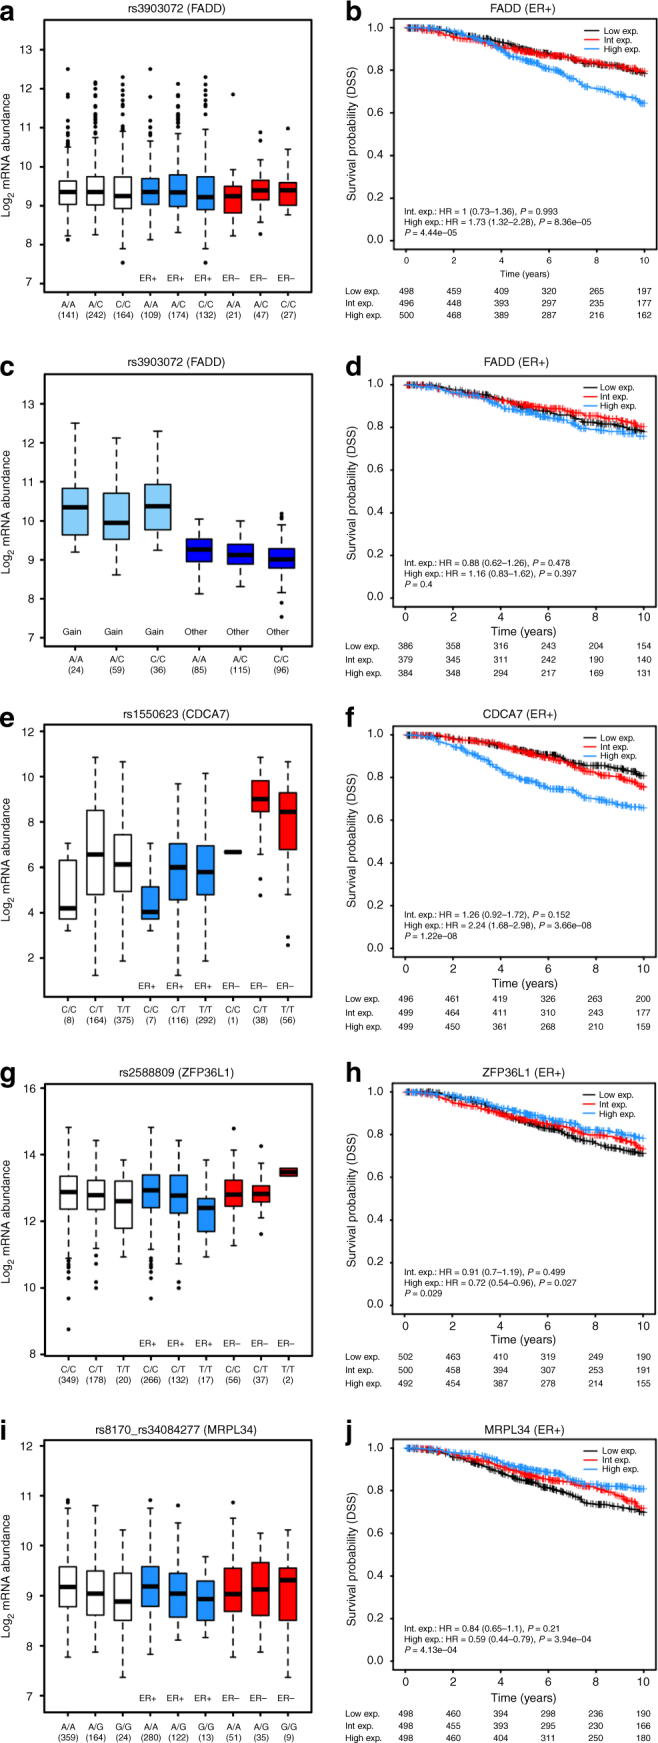
Box plots of gene expression according to genotype and Kaplan–Meier plots of disease-specific survival according to levels of expression for FADD (11q13), CDCA7 (2q31.1), ZFP36L1 (14q24.1) and MRPL34 (19p13.1). a Levels of expression of FADD are associated with 11q13.1-rs3903072 genotype in all cancers (P = 0.04) and ER+ cancers (P = 0.01); b in ER+ cancers, levels of expression of FADD are also associated with disease-specific survival (DSS) (c) excluding samples with copy-number gains strengthened the eQTL association in ER+ cancers (P = 0.004) (d) but attenuated the association with DSS. e, g, i Levels of expression of CDCA7, ZFP36L1 and MRPL34 are associated with 2q31.1-rs1550623 genotype in all cancers (P = 0.007), 14q24.1-rs2588809 genotype in ER+ cancers (P = 0.004) and 19p13.1-rs8170 in all cancers (P = 0.001) and ER+ cancers (P = 0.01), respectively. f, h, j In ER+ cancers, levels of expression of all three genes are associated with DSS