Figure 7.
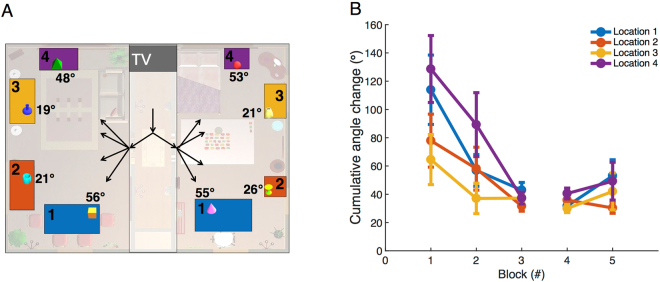
Analysis of head movements. (A) Top-down view of the room with targets shown on the surfaces. The angular deviations of the targets when looking straight ahead while entering the room in which they reside are marked next to the targets. The surfaces are colored by locations in the room: Locations 1–4. (B) Cumulative angular change in head direction from when the scene became visible until target was found (N = 19). Data represent mean ± SEM.

