Fig. 5.
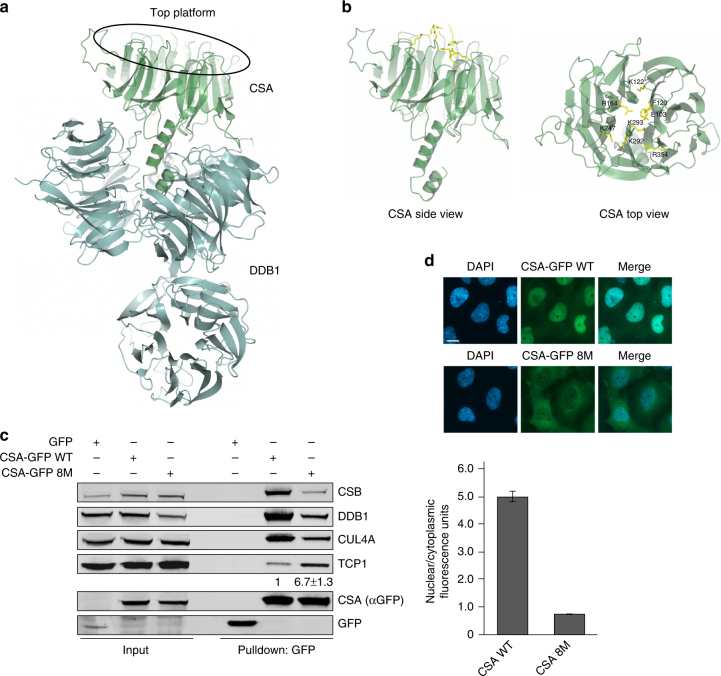
A CSA mutant of the top platform shows increased TRiC binding. a Overall structure of CSA (green) bound to DDB1 (blue), showing that not CSA’s top platform, but its N-terminus is directly involved in DDB1 binding. Visualization was done in ccp4mg using structure 4a11 from the PDB. b Side and top view of CSA. The amino acids Glu103, Phe120, Lys122, Arg164, Lys247, Lys292, Lys293, and Arg354 in CSA’s top platform that were mutated to Alanines in the CSA 8M mutant are shown in yellow. c The CSA 8M mutant shows decreased incorporation into the CRLCSA complex, but increased TCP1 binding. CSA-GFP WT and CSA-GFP 8M were pulled down from CS3BE-SV40 cells. Protein levels were determined by western blot analysis of the indicated proteins. The ratio of TCP1 signal intensity over CSA-GFP 8M relative to that of TCP1 over CSA-GFP WT, which was set to 1, is shown as the mean ± SEM of two independent experiments. d CSA-GFP 8M shows reduced protein abundance in the nucleus concomitantly with an increase in cytoplasmic localization. Mean nuclear and cytoplasmic GFP levels were analyzed and quantified by fluorescence microscopy and ImageJ. For each cell the nuclear/cytoplasmic ratio was calculated. Data represent mean ± SEM of 160 cells quantified in two independent experiments. Length of scale bar: 10 µm. Full-size scans of western blots are provided in Supplementary Fig. 10

