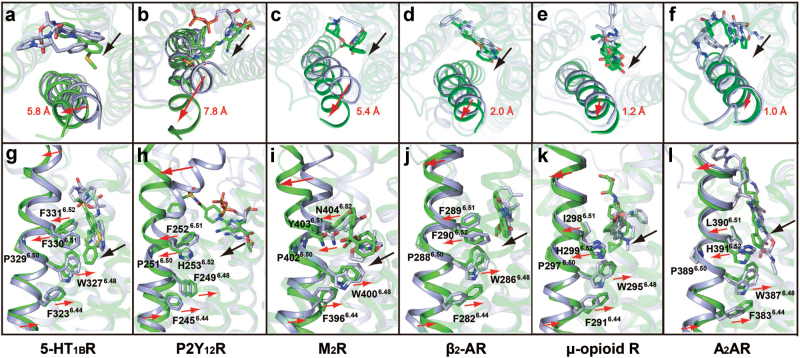
Fig. 5. Structure alignment of TM6 and ligands of class A GPCR complexes.
a–f Extracellular views of TM6 and ligands. g–l Side views of TM6 and ligands. a and g 5-HT1BR in complex with inverse agonist MT vs. agonist ERG (PDB code: 4IAR), b and h P2Y12R in complex with antagonist AZD1283 (PDB code: 4NTJ) vs. agonist 2MeSADP (PDB code: 4PXZ), c and i M2R in complex with inverse agonist QNB (PDB code: 3UON) vs. agonist iperoxo (PDB code: 4MQT), d and j β2-AR in complex with inverse agonist carazolol (PDB code: 2RH1) vs. agonist BI-167107 (PDB code: 3SN6), e and k μ-opioid R in complex with antagonist β-FNA (PDB code: 4DKL) vs. agonist BU72 (PDB code: 5C1M), f and l A2AR in complex with antagonist ZM241385 (PDB code: 4EIY) vs. agonist UK-432097 (PDB code: 3QAK). Red arrows indicate the movements of TM6 and the side chains of highly conserved residues at positions 6.44, 6.48, 6.51, and 6.52, and black arrows show the shifts of inverse agonists/antagonists compared with agonists in the ligand binding pockets. All GPCRs in inactive conformation are shown in green, while those in active conformation are displayed in light blue. Inverse agonists/antagonists are colored green, and agonists are in light blue. The shift distances of extracellular ends of TM6 between active and inactive conformations are labeled in red with residues at position 6.60 as reference point

