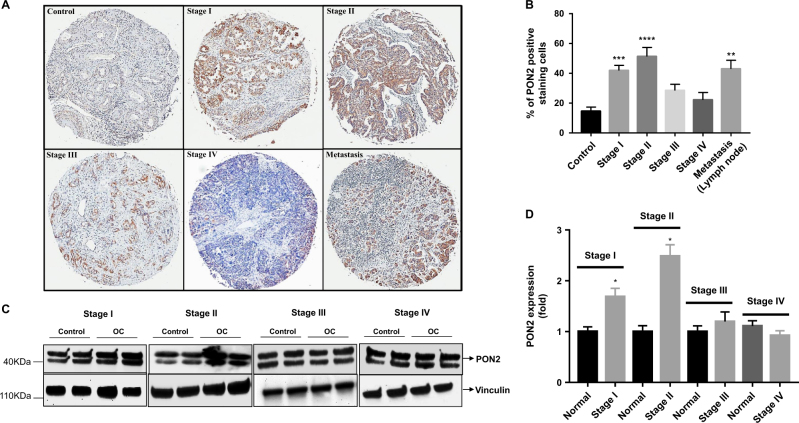
Fig. 1. PON2 protein is induced in early stage ovarian cancer.
Immunohistochemistry was performed on ovarian carcinoma tissue array slides (US Biomax Rockville, MD, USA) using PON2 antibody as described under the Materials and methods section. PON2 protein expression was quantified using Definiens Tissue Studio Software. Representative photographs of the staining are shown in a, and the quantification of the data is presented in b. Values are expressed as percentage of PON2-positive staining cells. Total protein lysates from matched normal and ovarian tumor tissues [stage I (n = 7), stage II (n = 10), stage III (n = 12), and stage IV (n = 15)] were subjected western blotting analyses using hPON2 antibody. Representative blots (two sets from each stage) are shown in c. The data were quantified using Image J software and presented in d

