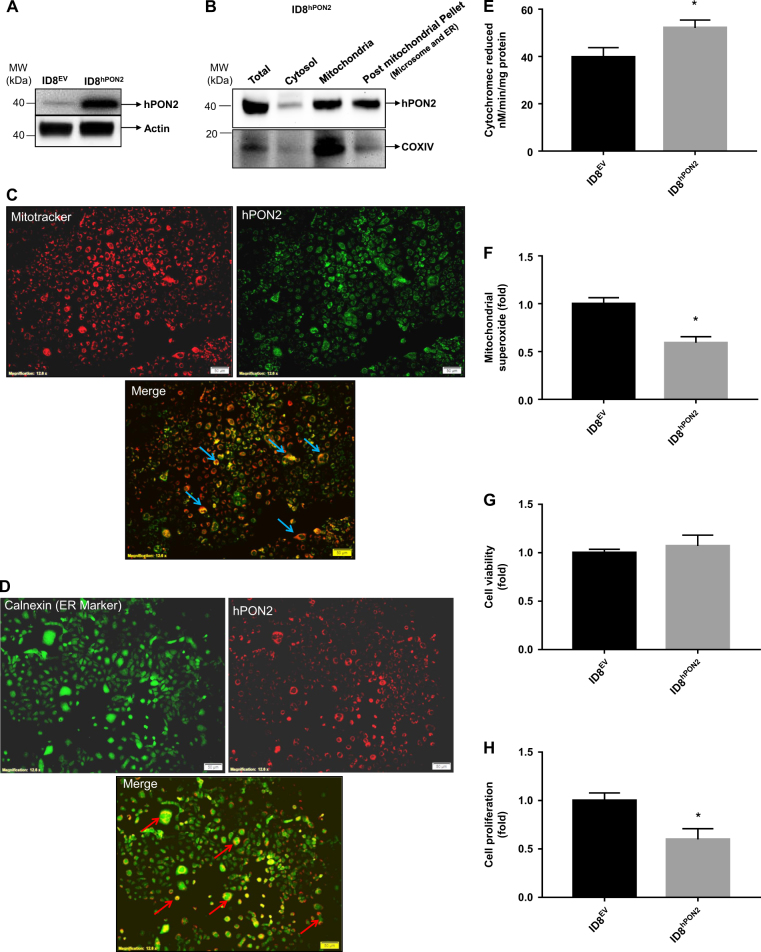
Fig. 2. Characterization of ID8EV and ID8hPON2 cells.
a) Expression of hPON2 protein was analyzed by western blotting in ID8EV and ID8hPON2 stable cell lines. b) ID8EV and ID8hPON2 cell fractions were subjected to western blotting for PON2 and COX IV proteins. c) Colocalization of mitochondrial marker and PON2. ID8EV and ID8hPON2 cell were fixed and stained with Mito Tracker® Red (a mitochondrial marker, red) and PON2 antibody (green). The merged image of hPON2 and mitochondria (yellow) is shown in the bottom panel. d) Colocalization of ER marker and PON2. ID8EV and ID8hPON2 cell were fixed and stained for Calnexin (green), an ER marker, and hPON2 (red). The merged image of hPON2 and Calnexin is shown in the bottom panel. e) Mitochondria were isolated from ID8EV and ID8hPON2 cells and respiratory complex II + III assay was carried out as described in Materials and methods section. The results are expressed as Cytochrome c reduced/min/mg protein. f) mitochondrial superoxide levels were measured as described in the methods and values were expressed as fold change over the ID8EV. *p < 0.05 compared to IDEV cells. g) ID8EV and ID8hPON2 cells were cultured for 48 h, serum starved for 12 h, and cell viability was measured as described in the method section. h) 5 × 10³ ID8EV and ID8hPON2 cells were cultured for 48 h, serum starved for 12 h and cell proliferation was assessed using BrdU by spectrophotometry as described in the Materials and methods section

