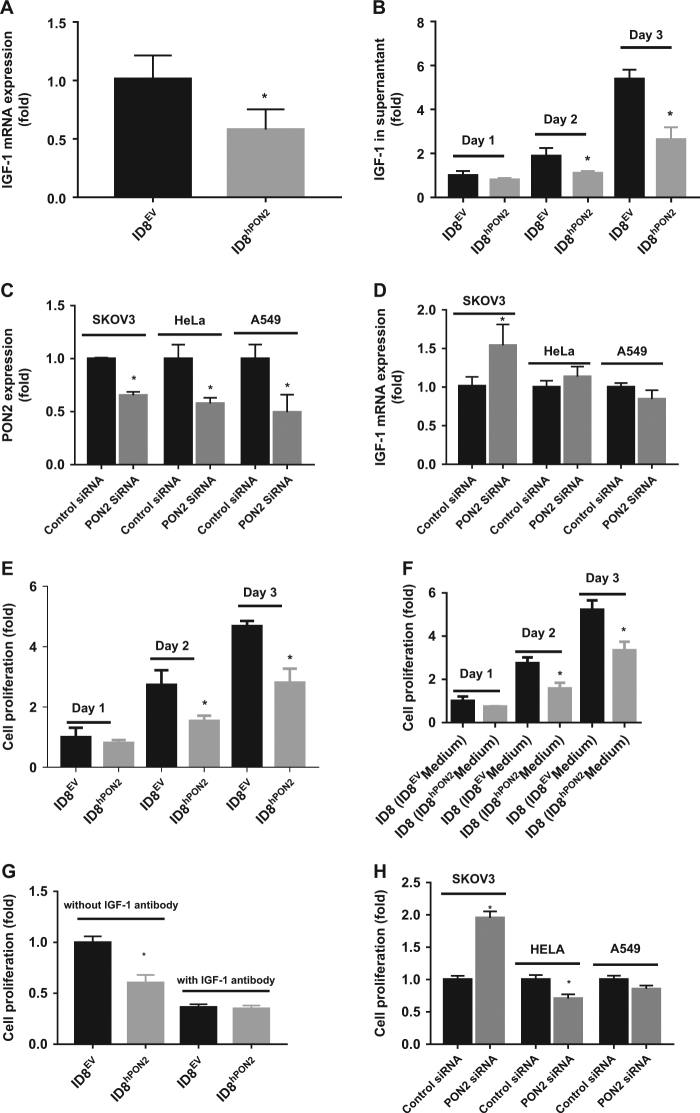
Fig. 4. PON2 overexpression reduces IGF-1 expression and inhibits cell proliferation in ID8 cells.
a) 3 × 10⁵ ID8EV cells or ID8hPON2 cells were cultured on six-well plates in DMEM medium containing high glucose and l-glutamine (2 mM) and supplemented with 4% fetal bovine serum (FBS), penicillin (100 U ml−1), streptomycin (100 μg ml−1), and 1× ITS liquid media supplement (10 μg ml−1 insulin, 5 μg ml−1 transferin, and 5 ng ml−1 sodium selenite). Cells were incubated at 37 °C for 24 h in 5% CO2 and then starved for 12 h in serum free media. Total RNA was isolated and cDNA was prepared as described under materials and methods. IGF-1 mRNA was quantified by qPCR and normalized to cyclophilin. b) 3 × 10⁵ ID8EV and ID8hPON2cells were grown 1–3 days and each day serum starved for 12 h, then cell culture supernatants were collected and IGF-1 protein levels were quantified by ELISA as described under Materials and methods. hPON2 siRNA or scrambled siRNA was transfected into SKOV3, HeLa, and A549 cells at 70% confluence. PON2 protein expression was quantified after 2 days as described under the Materials and methods (c). Total RNA was isolated and IGF-1 was quantified by qPCR (d). e) 5 × 10³ ID8EV and ID8hPON2 cells were grown as indicated in b and cell proliferation was assessed using Brdu by spectrophotometry as described in the Materials and methods. f) ID8EV and ID8hPON2 cells were grown and serum starved as in b and each day conditioned media were collected. Subsequently, the media were incubated with ID8 cells for 48 h, and cell proliferation was assessed as described in the Materials and methods section. g) ID8EV and ID8hPON2 cells were grown for 2 days and serum starved for 12 h with 500 nM IGF-1 antibody (# ab9572, Abcam) or without IGF-1 antibody and cell proliferation was assessed as described in the materials and methods section. h) Following hPON2 siRNA transfection with SKOV3, HeLa, and A549 cells, cell proliferation was assessed using FITC Brdu. Brdu-positive cells were quantified using flow cytometer. *p < 0.05, compared to ID8EV. Values were expressed as fold (n = 3)

