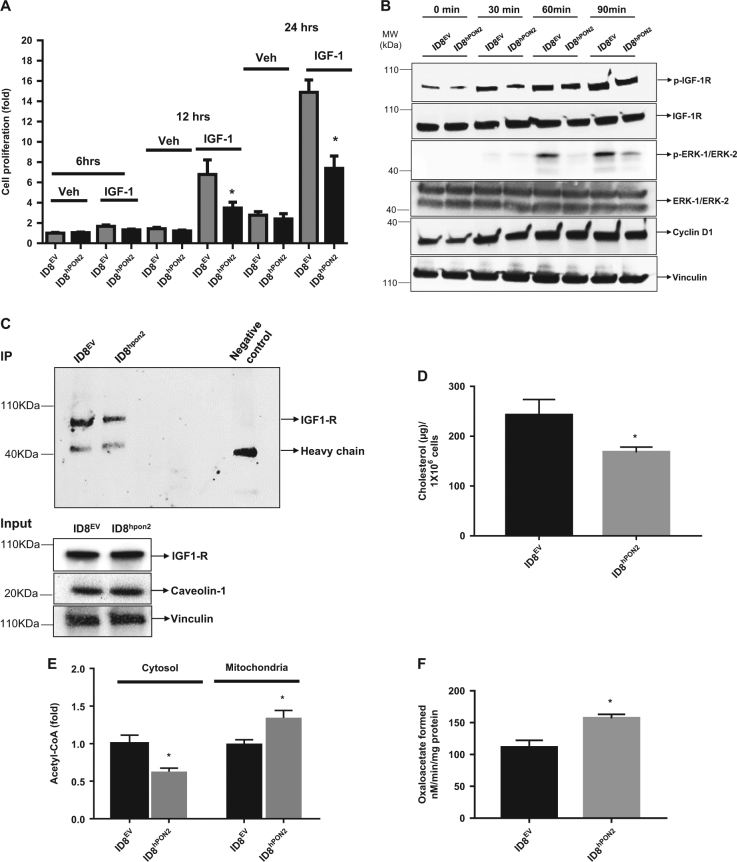
Fig. 6. Overexpression of hPON2 inhibits cell proliferation via IGF-1 signaling pathway by altering the caveolin-1 and IGF-1R interaction in ID8 cells.
a) 5 × 10³ cells were plated in 96 well plates and were incubated at 37 °C in 5% CO2. After 24 h, cells were serum starved for 12 h. Following this, cells were treated with IGF-1 at the concentration of 500 nM or vehicle for 6 h, 12 h, and 24 h. Cell proliferation was measured as described above. b) ID8EV cells or ID8hPON2 cells were cultured in six-well plates as described above and treated with IGF-1 at the concentration of 1 µM for 30, 60, and 90 min. 50 µg of total protein (100 µg for ERK1/2) was subjected to western blotting and phosphorylated IGF-1R, total IGF-1R, phosphorylated ERK1/2, total ERK1/2, cyclin D1, and vinculin were detected using respective antibodies as described in the materials and methods section. c) Immunoprecipitation was performed with caveolin-1 antibody and IGF-1R was detected by western blotting. d) Lipids were extracted from ID8EV and ID8hPON2 cells using chloroform: isopropanol: NP (7:11:0.11), air dried at 50 °C to remove the chloroform and placed under vacuum for 30 min, dispersed with assay buffer and cholesterol was measured as described in the Materials and methods section. e) Mitochondria and cytosol were isolated as described in the materials and methods section and acetyl CoA was measured using a kit according to manufacturer’s protocol. Values were normalized based on protein concentration. Values were expressed as fold change (n = 3). f) Citrate lyase enzyme activity was measured as described in the Materials and methods section. (n = 3). *p < 0.05, compared to ID8EV

