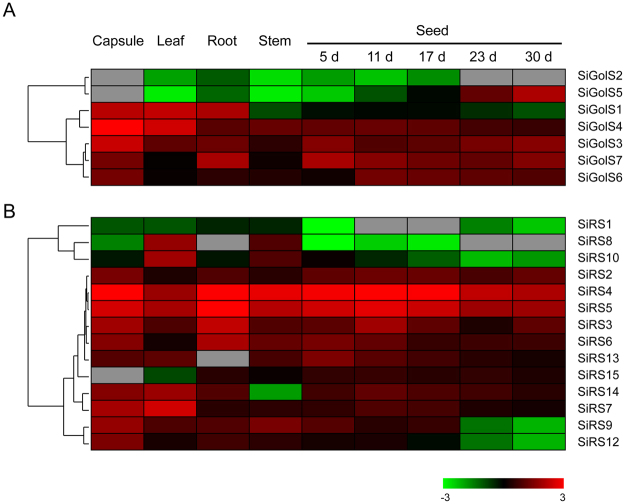
Figure 3.
Expression profiles of the SiGolS and SiRS genes in different tissues. Transcriptome data downloaded from Sesame Functional Genomics Database (SesameFG, http://www.ncgr.ac.cn/SesameFG) was used to measure the expression level of SiGolS (A) and SiRS (B) genes in capsule, leaf, root, stem and seed at different stage of development. Heat maps were constructed by Cluster 3.0 based on the log10-transformed RPKM values for each gene. Gray box indicated the expression data is not available in this organ or time point. The color scale for expression values is shown.

