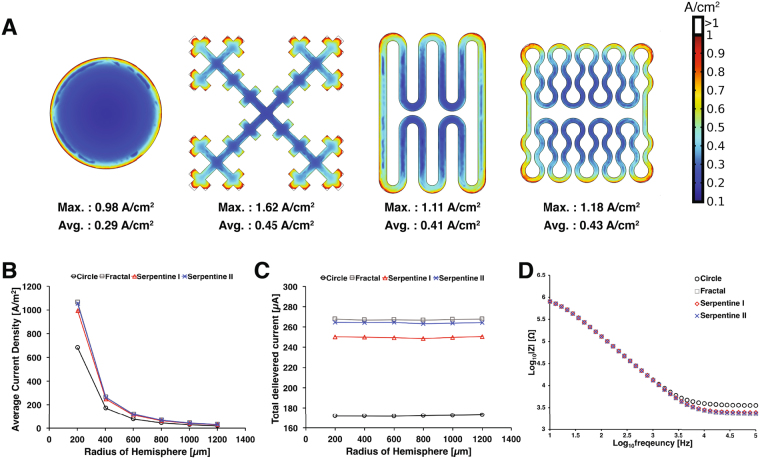
Figure 2.
The current density distribution of different electrode design using the voltage-control stimulation (−0.6 V). (A) The current density surface plot for each microelectrode design. Both the maximum and the average current density across the electrode surface was highest for the fractal design followed by serpentine II, serpentine I, and circular electrode. (B) Average current density as a function of distance away from each electrode center. (C) The total delivered current on hemispheric boundaries. (D) Simulated impedance Bode plot of each microelectrode design.

