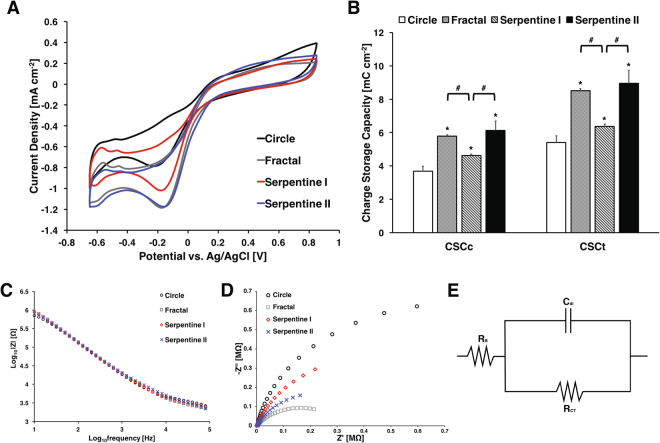
Figure 3.
(A) Comparison of representative cyclic voltammogram of Pt microelectrodes in PBS. (B) Charge storage capacity of each microelectrode (n = 5 for each). ANOVA results revealed significant differences (p < 0.01) as compared to circular electrodes (*), and significant differences (p < 0.01) between fractal and serpentine I, serpentine I and serpentine II. (C) Representative impedance spectra of microelectrodes with different shapes The impedance spectra of microelectrodes in PBS. (D) Nyquist plot of microelectrodes (E) Randle’s circuit for equivalent circuit model analysis.

