Figure 3.
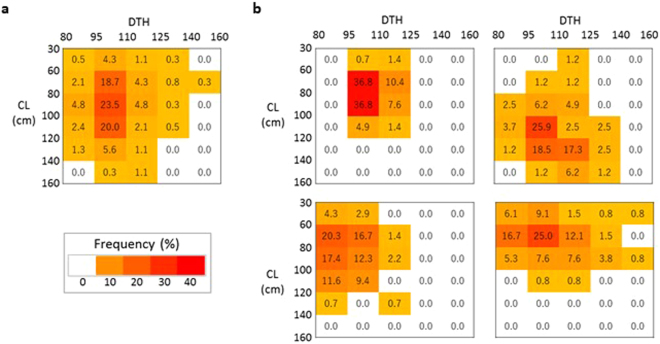
Phenotypic diversity of 376 JAM lines and RILs. (a) JAM lines. (b, top left) HOMI-RILs, (b, bottom left) TKBE-RILs, (b, top right) RUTC-RILs, and (b, bottom right) SUAK-RILs. Phenotypic diversity is shown as heat maps of the frequencies of lines with different combinations of DTH (days to heading) and CL (culm length). The DTH range was divided into five categories and that of CL into six categories. The frequency of lines with each DTH–CL combination is shown in the centre of each cell.

