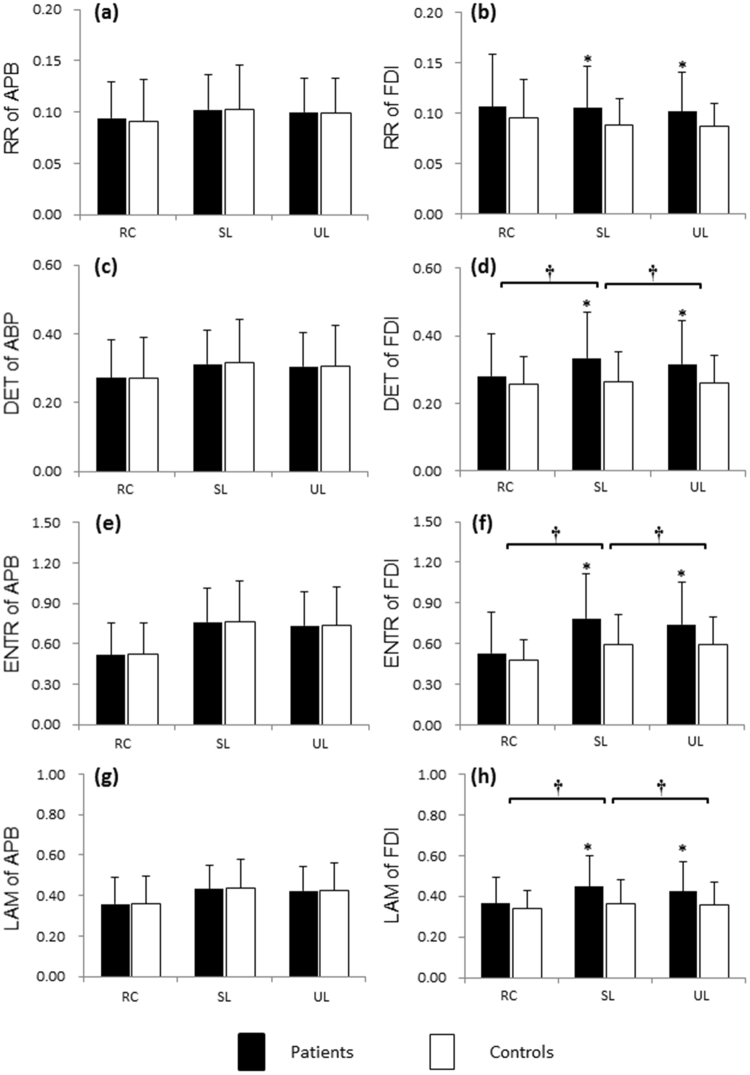
Figure 4.
Statistical analysis of RQA parameters of the APB and FDI for precision grip. (a,c,e,g) RR, DET, ENTR and LAM of the APB under the relaxed, stable load and unstable load conditions; (b,d,f,h) RR, DET, ENTR and LAM of the FDI under the relaxed condition (RC), with stable load (SL) and unstable load (UL). *Significant difference between the patients and controls (p < 0.05). †Significant difference across the load conditions (p < 0.05).

