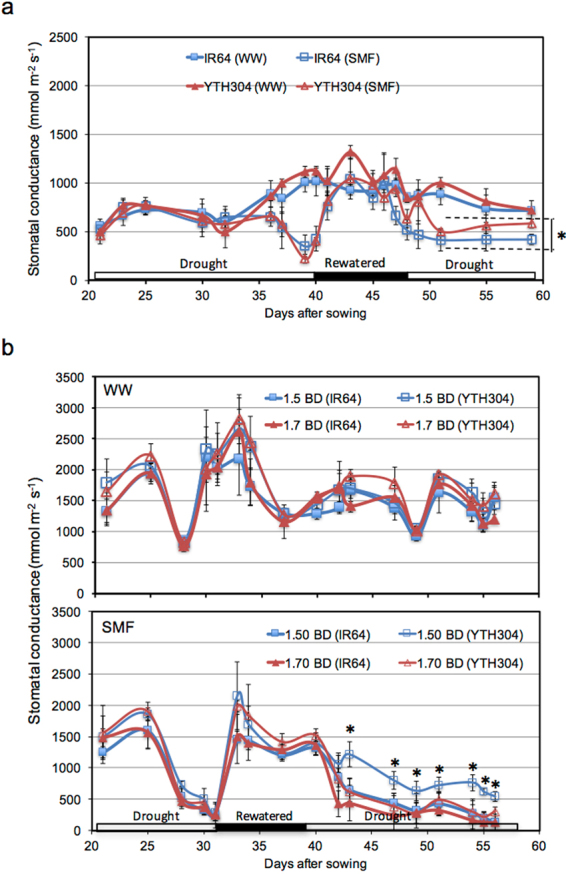
Figure 4.

The response of stomatal conductance in IR64 and its INL, YTH304 under different water treatments in Exp. 1 (a) and under different water and hardpan bulk density (BD) treatments in Exp. 2 (b). Horizontal bars along x-axis indicate the prevailing soil moisture conditions during SMF. The BD of the shallow layer was 1.25 g cm−3 while that of the hardpan layer was 1.50 g cm−3 in Exp. 1 and either 1.50 or 1.70 g cm−3 in Exp. 2. WW, well-watered and SMF, soil moisture fluctuation treatments. Error bars represent the standard deviation calculated from 3 replicates. *Indicates significant difference between YTH304 and IR64 under SMF with 1.50 g cm−3 BD only at P < 0.05, by Student’s t-test.
