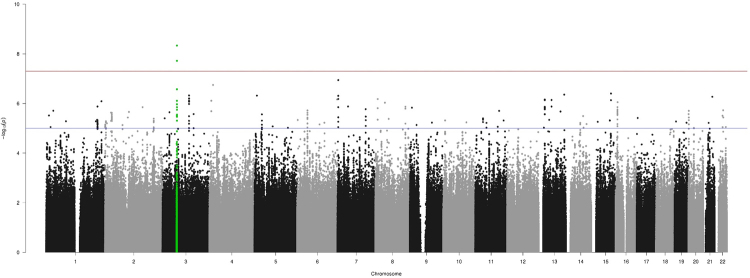
Figure 1.
Genome-wide assocation analysis in the FC IA discovery cohort. Imputed using HRC panel, 7,614,484 variants passed QC are included in making the manhattan plot. X-axis shows the physical position along the genome. Y-axis shows the −log10 (p-value) for association. Red line indicates the level of genome-wide significant association (p = 5 × 10⁻⁸); blue line indicates the level of suggestive association (p = 5 × 10⁻⁶). Green dots indicate FHIT SNPs.

