
Figure 3.
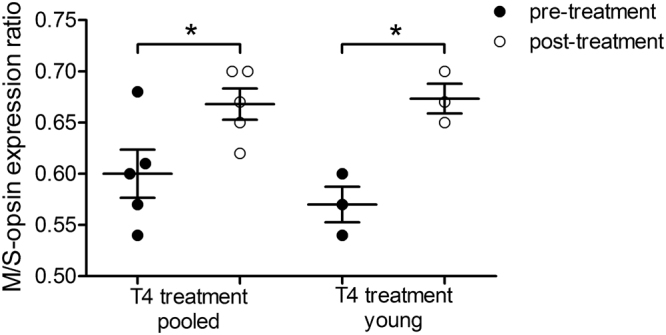
M-opsin/S-opsin expression ratios pre- and post-treatment in the retina of T4 treated animals. The opsin expression data for each eye were normalised by calculating the M-opsin/S-opsin expression ratio to control for different baseline expression levels in each eye (pre- and post-treatment). This allows comparison of relative differences between M- and S-opsin expression between both eyes, an alternative measure for changes in M-opsin expression levels. A significant increase was found in pooled data and after exclusion of animals older than 1,000 days (young), indicating that M-opsin expression is increased at a higher degree than S-opsin expression (two-tailed paired t-test). The effect in pooled data is lower (p = 0.046, n = 5) compared to young data (p = 0.028, n = 3). Data are presented as median ± interquartile range. *p < 0.05.