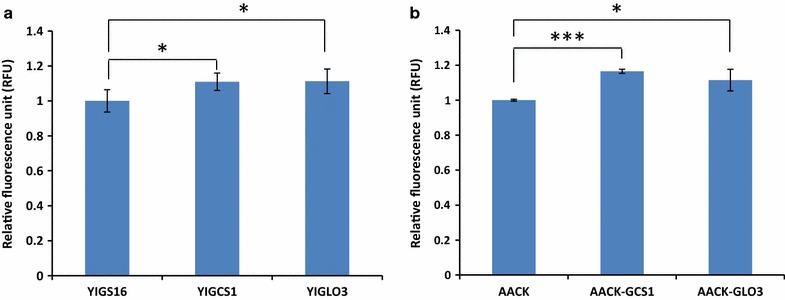
Fig. 2.

The amounts of ER membrane of strains a YIGS16, YIGCS1 and YIGLO3. b AACK, AACK-GCS1 and AACK-GLO3 using ER-Tracker Blue-White DPX. The ER membrane changes were quantified by their fluorescence intensity. *P < 0.05; ***P < 0.001. Measurements are reported as the average value ± standard deviation from independent triplicates
