
Figure 1.
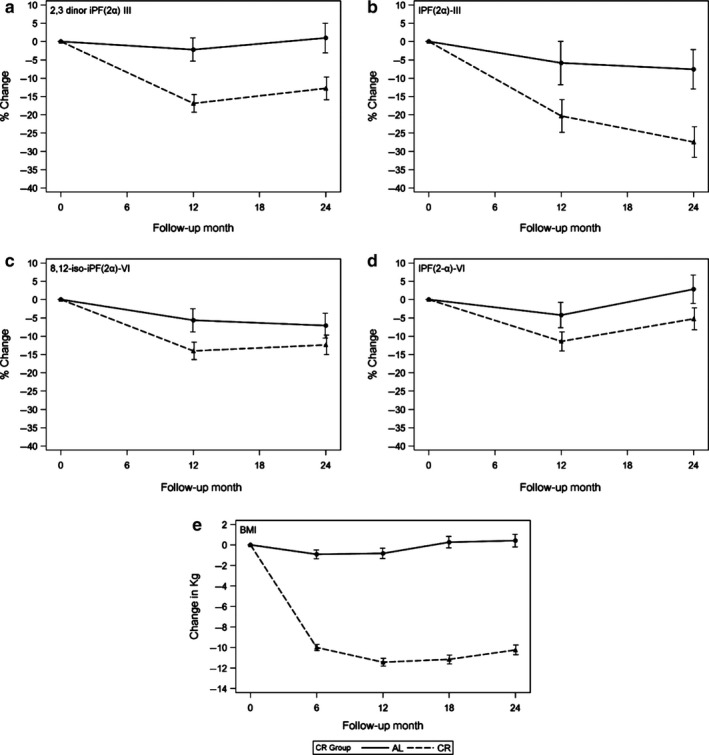
Change in urinary F2‐isoprostane concentrations and in body weight within CR and AL groups. Percent change in each F2‐isoprostane species as compared to the baseline level: (a) 2,3‐dinor‐iPF(2 α)‐III, (b) iPF(2α)‐III, (c) iPF(2 α)‐VI, (d) 8,12‐iso‐iPF(2α)‐VI, (e) body weight