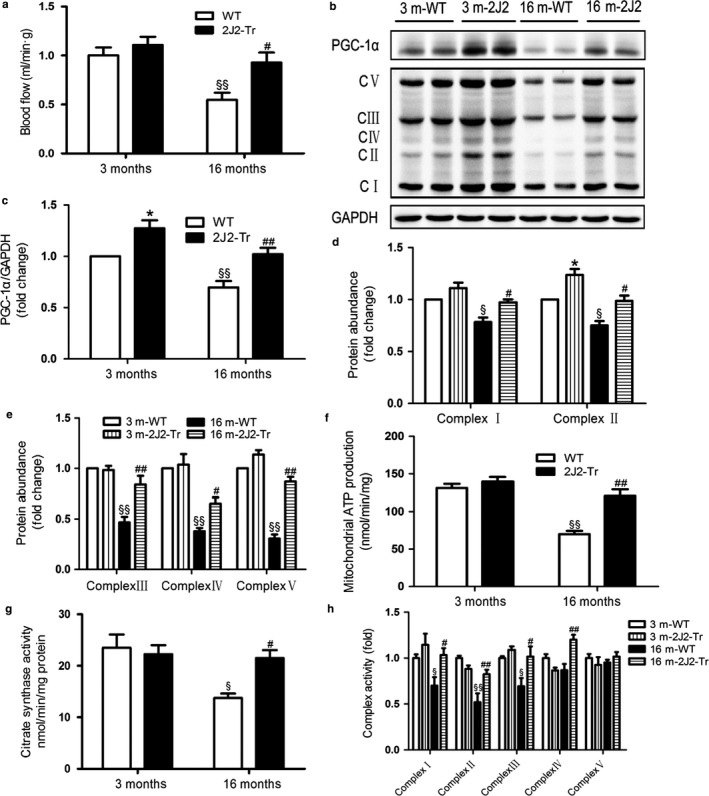
Figure 7.

Mitochondrial content and function are increased in muscles of aged CYP2J2 overexpression mice. (a) Gastrocnemius muscle blood flows of the different experimental groups of mice were measured with the fluorescent microsphere method. (b–e) Representative immunoblots and quantitation of PGC‐1α and mitochondrial ETC. chain protein in different groups. (f) Skeletal muscle ATP levels, (g) citrate synthase (CS) activity, (h) activities of the electron transport chain (ETC.) complexes I‐V were assayed as described in MATERIALS AND METHODS. Data are shown as means ± SE (n = 8 per genotype). *p < .05, 3 m2J2‐Tr vs. 3 mWT; § p < .05,16 mWT vs. 3 mWT; §§ p < .01, 16 mWT vs. 3 mWT; # p < .05, 16 m2J2‐Tr vs. 16 mWT; ## p < .01, 16 m2J2‐Tr vs. 16 mWT
