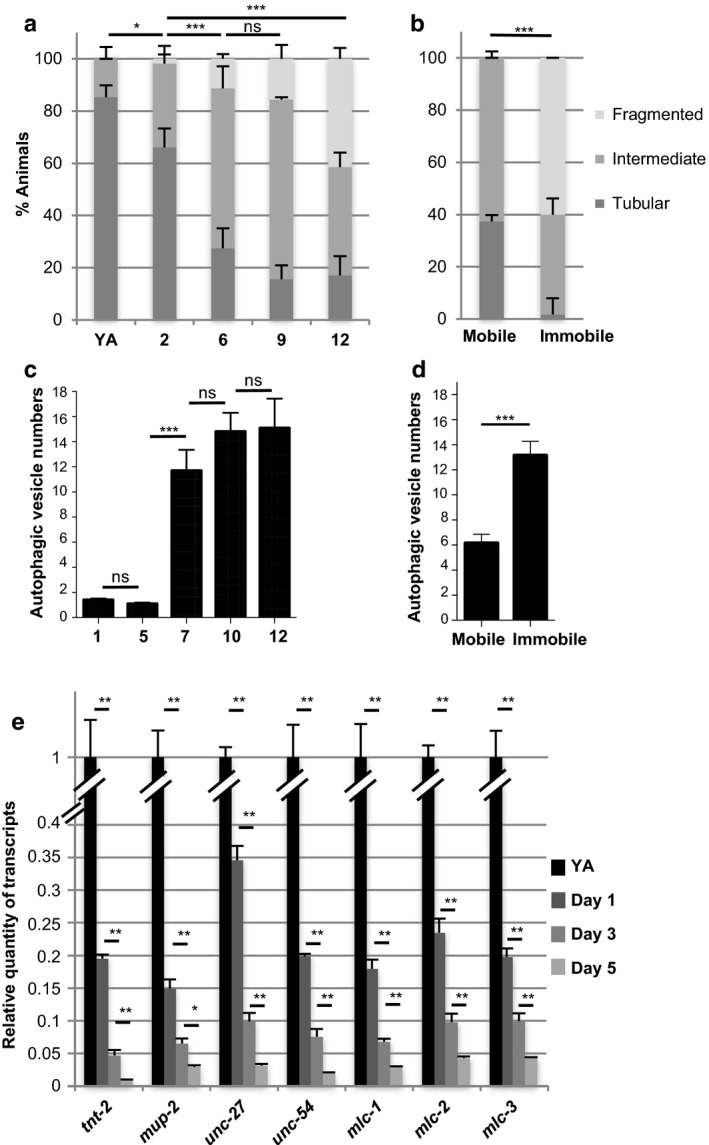
Figure 1.

Time course quantification of muscle changes associated with loss of mobility with aging. (a–b) Quantification of animals with the indicated muscle mitochondria phenotypes at different ages from the young adult (YA) stage (n = 41, 56, 62, 45, and 94 for YA, days 2, 6, 9, and 12, respectively) (a) or at day 9, in worms which have been sorted according to their mobility phenotype (n = 59 and 60 for mobile and immobile worms, respectively) (b). Bars are mean ± SEM, chi‐square test. (c–d) Quantification of autophagic vesicles number per muscle cell at the indicated ages (n = 35, 40, 48, 63, and 41 for days 1, 5, 7, 10, and 12, respectively) (c) or at day 9 of adulthood, in worms which have been sorted according to their mobility phenotype (n = 38 and 27 for mobile and immobile worms, respectively) (d). Bars are mean ± SEM, (c) Kruskal–Wallis and Dunn's post hoc test or (d) Mann–Whitney test. (e) Relative quantity of muscle‐specific gene transcripts at different ages during adulthood. For each gene, levels were normalized to the YA value. Bars are mean ± SEM (n = 6), Mann–Whitney test
