Figure 3.

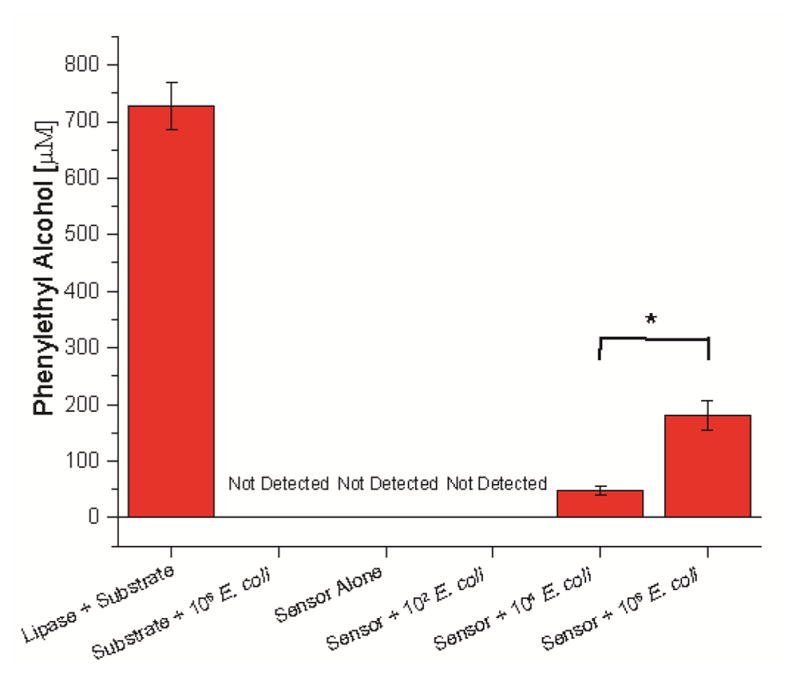
Headspace gas chromatography analysis of sensor response to increasing concentrations of bacteria. Samples were prepared in triplicate. Error bars represent standard deviations of the measurements. *= p< 0.05, ***=p<0.001.

Headspace gas chromatography analysis of sensor response to increasing concentrations of bacteria. Samples were prepared in triplicate. Error bars represent standard deviations of the measurements. *= p< 0.05, ***=p<0.001.