
Figure 2. Superstructure evolution triggered by environmental ionic strength.
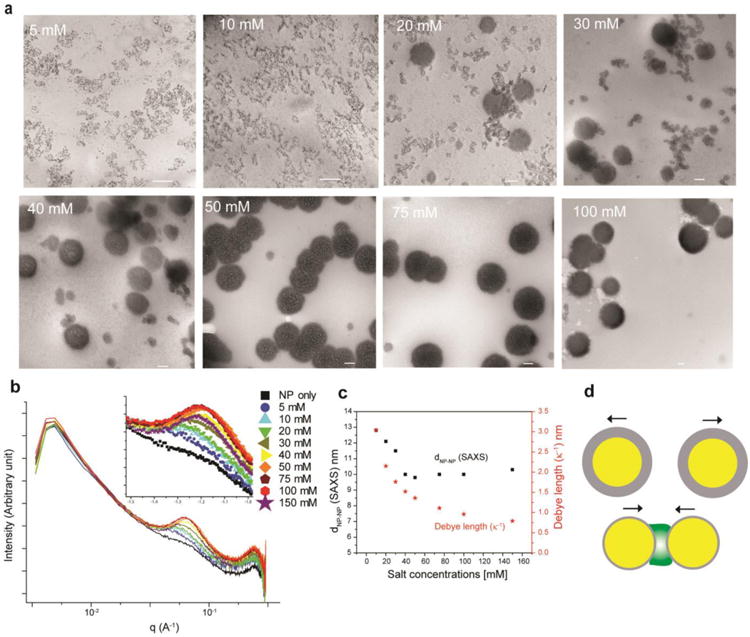
(a) TEM images of salt-induced superstructures between GFP-E10 and ArgNPs. Scale bar: 100 nm. (b) SAXS inspection of superstructure formation at various salt concentrations showing the gradual intensity enhancement and a shift in q value arising from superstructure formation. (c) Comparison of inter-particle distance (dNP-NP) of the assemblies with theoretical Debye length (κ-1) at different salt concentrations. (d) Physical principle governing superstructure formation. Yellow core and gray shell represent ArgNPs and the Debye screening layer respectively (top), whereas GFP-E10 is depicted in green (bottom).