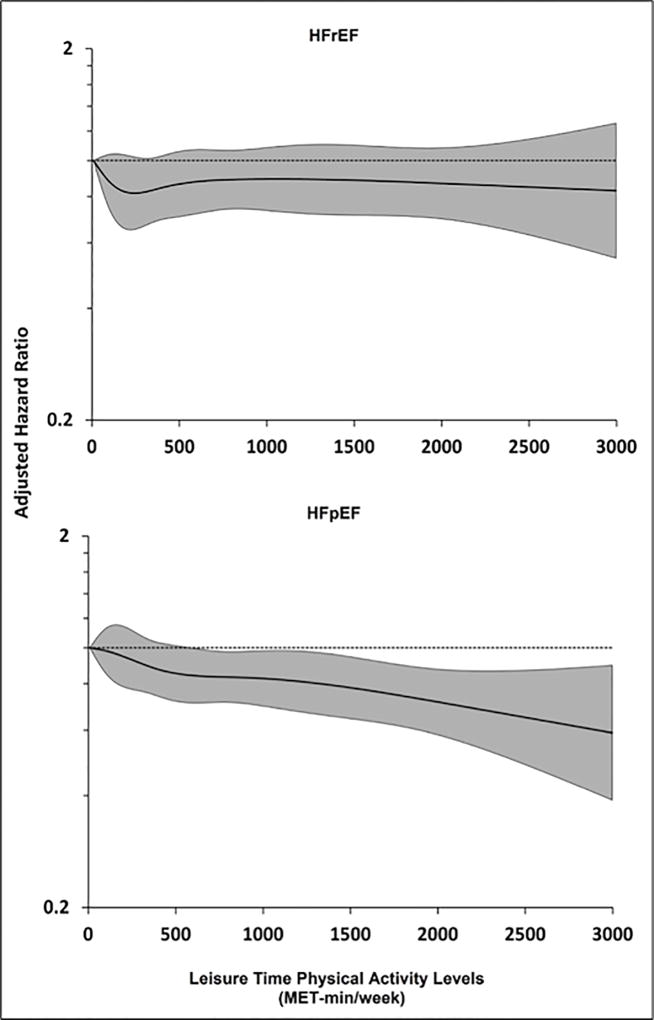
FIGURE 3. Continuous Association Between LTPA Levels and Risk of HF Subtypes.
Restricted cubic splines showing continuous adjusted association between LTPA levels (MET-min/week) and risk of HFrEF (top panel) and HFpEF (bottom panel). The shaded area shows the 95% confidence interval for the hazard ratio point estimates associated with different LTPA levels. MET = metabolic equivalent. Other abbreviations as in Figure 2.

