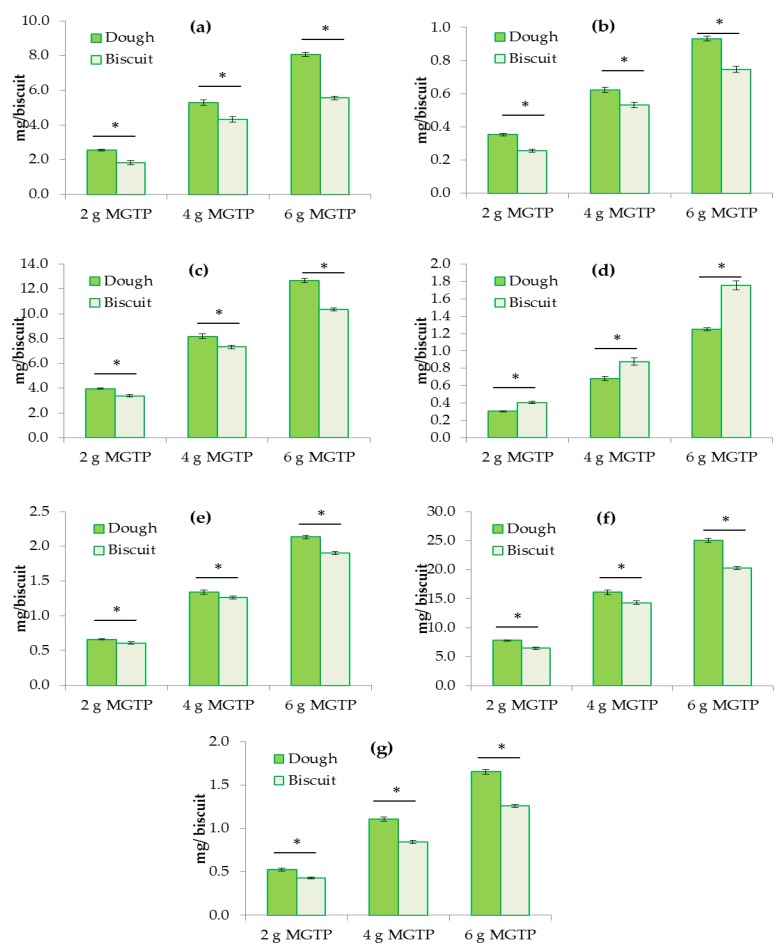
Figure 2.
Amount of catechins in dough and shortbread enriched with 3 levels of MGTP (2, 4, 6 g 100 g−1 of flour): (a) EGC; (b) EC; (c) EGCG; (d) GCG; (e) ECG; (f) total catechins and (g) caffeine. Results are expressed as mg per biscuit. * indicates a significant difference (p < 0.05) before and after baking. The error bars represent the SEM (standard error of the mean) (n = 12 biscuits).

