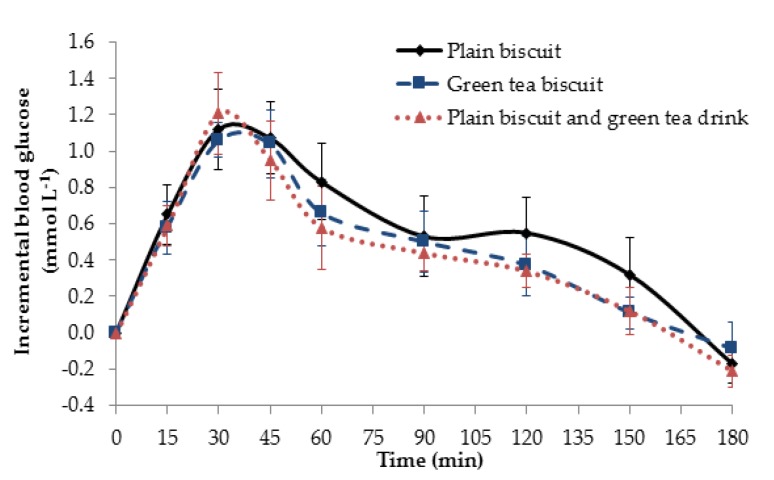
Figure 5.
Mean incremental blood glucose response curves after ingestion of control and test meals over 180 min. (-◆-) represents the blood glucose curve of the control meal that consisted of plain biscuit consumed with warm water, (-■-) represents the blood glucose curve of the test meal with Matcha green tea biscuits consumed with warm water, and (..▲..) represents the blood glucose curve of the test meal with plain biscuits consumed with a Matcha green tea drink. Data expressed as the amount of blood glucose in mmol·L−1 and the error bars represent the SEM (n = 10).

