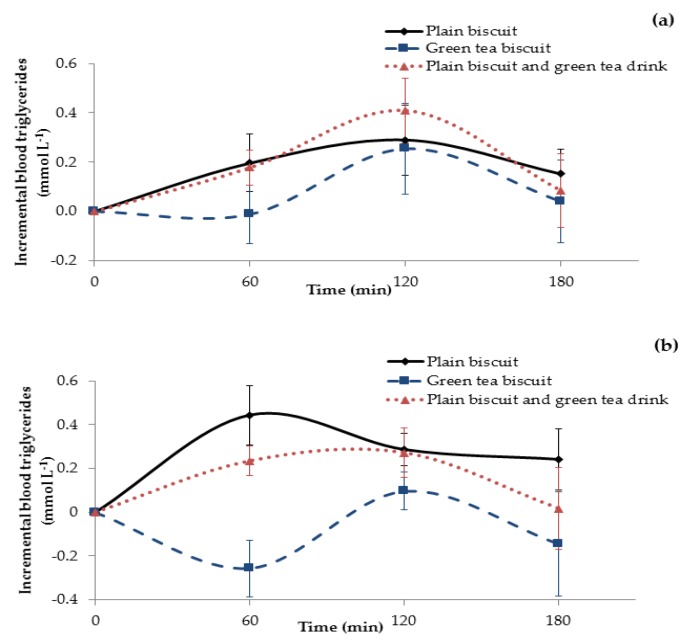
Figure 6.
(a) The mean incremental blood triglyceride response curves after ingestion of control and test meals over 180 min (n = 10 participants); (b) the mean incremental blood triglyceride response curves after ingestion of control and test meals over 180 min among Asian subjects (n = 4 participants). (-◆-) represents the blood triglyceride curve of the control meal consisting of plain biscuits, (-■-) represents the blood triglyceride curve of the test meal with Matcha green tea biscuits, and (..▲..) represents the blood triglyceride curve of the test meal with plain biscuits consumed with a Matcha green tea drink. Data expressed as the amount of triglycerides in mmol L−1 and the error bars represent the SEM.

