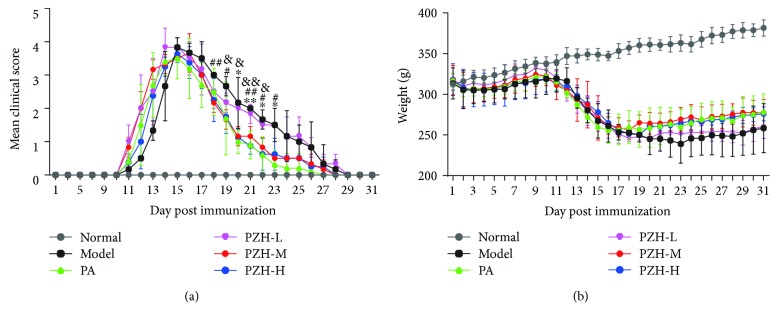
Figure 1.
PZH ameliorated clinical symptoms of EAE rats. (a) Time course changes of the mean clinical score in rats from the respective group. (b) Time course changes of body weight in rats from the respective group. Results are shown as mean ± SD. ∗P < 0.05 and ∗∗P < 0.01; PA group versus model group. #P < 0.05 and ##P < 0.01; PZH-M group versus model group. &P < 0.05 and &&P < 0.01; PZH-H group versus model group.

