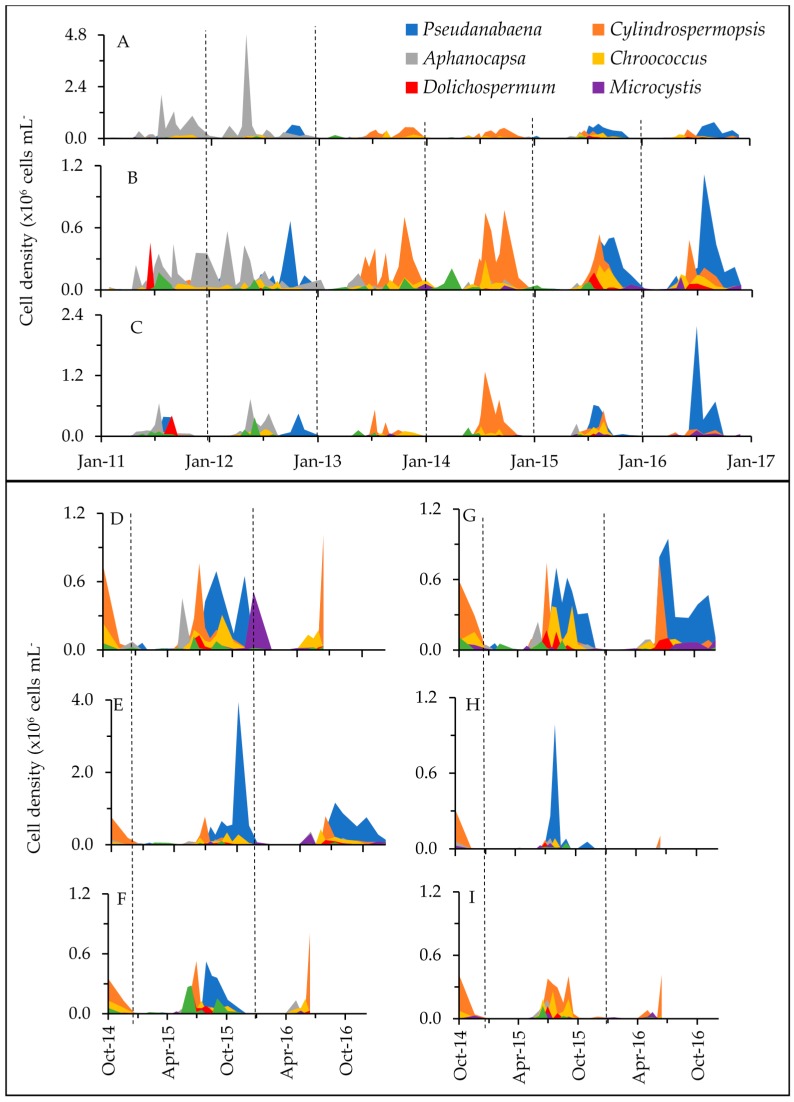
Figure 3.
Cyanobacterial cell densities at each of the sampling locations (sites A through I are shown as panels A through I). Colors depict the six most abundant genera, and less abundant taxa are grouped as “Other”. Long-term sites A through C were sampled from January 2011 to December 2016. D, F, H and I were monitored from October 2014 to June 2016, while monitoring at E and G continued through December 2016. Vertical dashed lines separate years. Note, there are differing scales on the y-axes for A, C and E.

