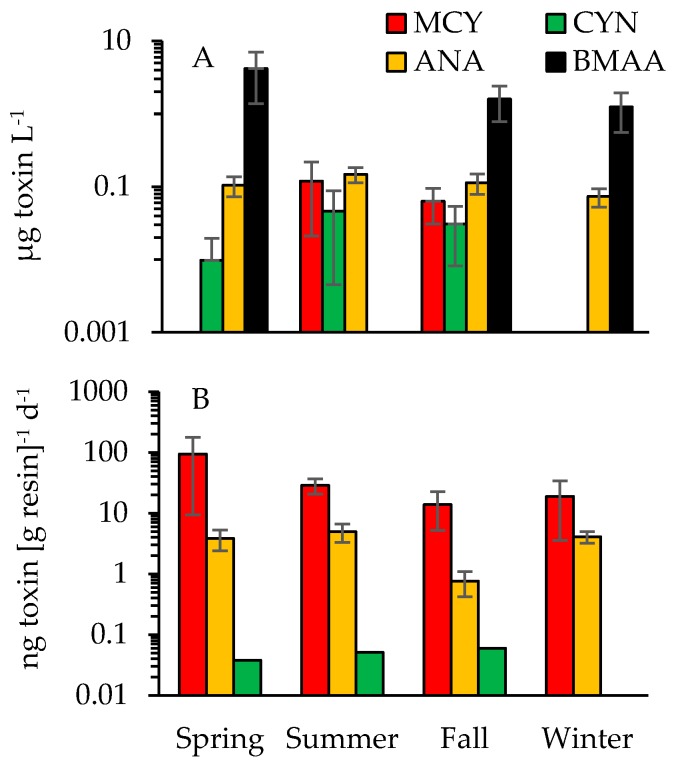
Figure 9.
Seasonal averages for dissolved toxin concentrations based on (A) discrete sample analyses for sites A through G and (B) in-situ tracking (SPATTs) of MCY, ANA and CYN for sites E and G. Standard error bars are included whenever multiple samples tested positive. Note there are differing log-scales on the y-axes.

