
Fig. 2.
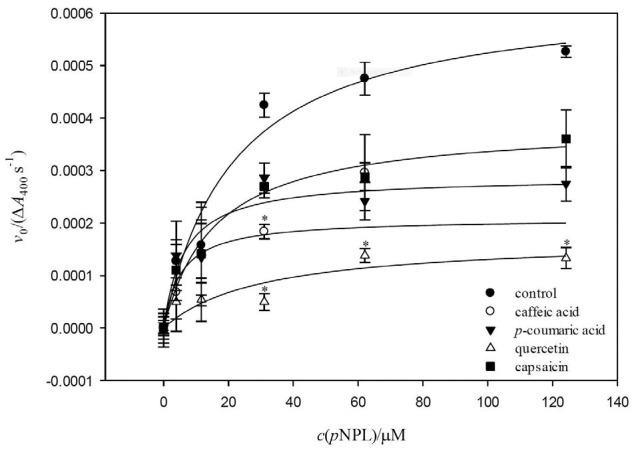
Effect of caffeic acid, p-coumaric acid, quercetin and capsaicin on the hydrolysis of p-nitrophenyl laureate (pNPL) catalyzed by pancreatic lipase. Symbols represent experimental initial reaction rate (v0 (expressed as ΔA400 nm/s))±standard deviation. The lines are Michaelis-Menten curves fitted to experimental data. Asterisk represents statistical difference between treatments (Fisher’s least significant difference analysis, p≤0.05)