
Figure 1. Frequency discrimination.
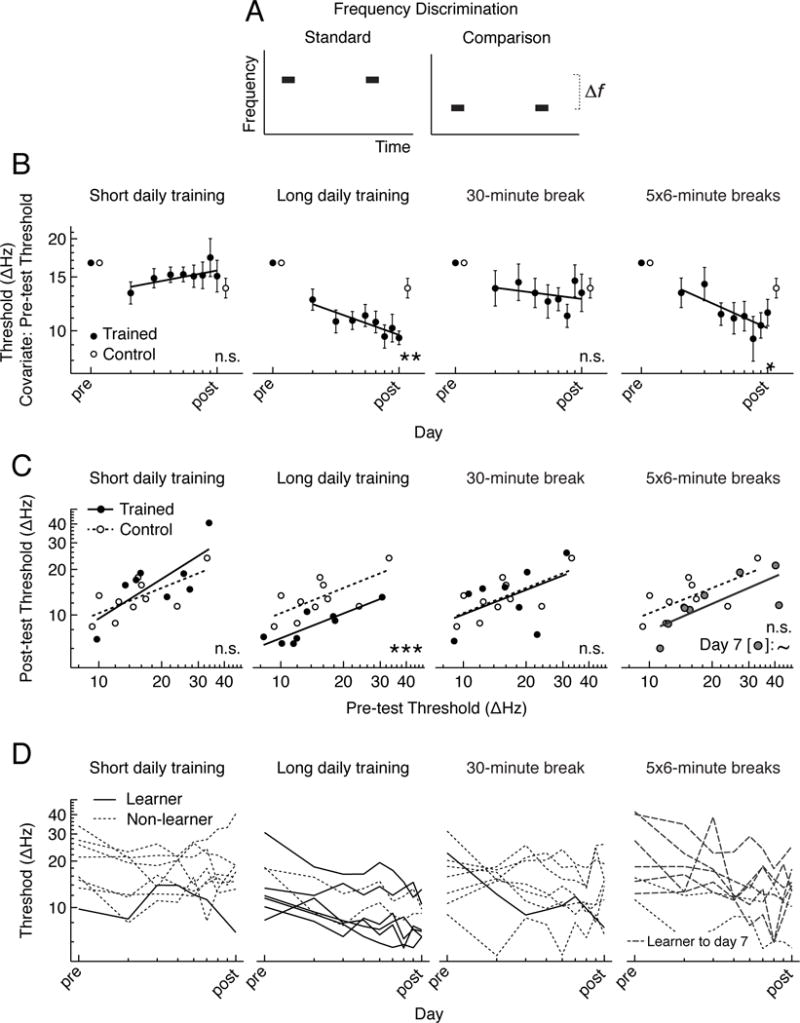
A. Frequency-discrimination task. B Group mean frequency-discrimination thresholds for the trained groups (n=8 per group; blackcircles) and controls (n=10; open circles) for each of the four training regimens (columns). Thresholds across days are adjusted using pre-test threshold as a covariate [7] and fitted with least-squares regression lines across the log of day number. Axis scales are in log units of day (x-axis) and frequency (y-axis). Error bars indicate +/− SEM. Asterisks denote significant improvement across the training sessions and post-test, as well as between the pre- and post-tests, for trained listeners (p ≤ 0.008). C. Individual pre-test (x-axis) versus post-test (y-axis) thresholds (symbols) on a log scale fitted with least-squares regression lines separately for trained listeners (solid lines; black circles; gray circles for day 7 thresholds) and controls (dashed lines; open circles). Asterisks denote significantly lower post-test thresholds for trained listeners than controls, using pre-test threshold as a covariate (p = 0.001). The tilde (“~”) indicates a trend for significance for day 7 thresholds vs. pre-test thresholds (p = 0.070). D. Individual frequency-discrimination thresholds across days for each of the four trained groups. Axis scales are in log units. Solid lines indicate significant learning from day 1 to the post-test (p ≤ 0.05), dashed lines significant learning from day 1 to day 7, and dotted lines no significant learning indicate a non-significant result.