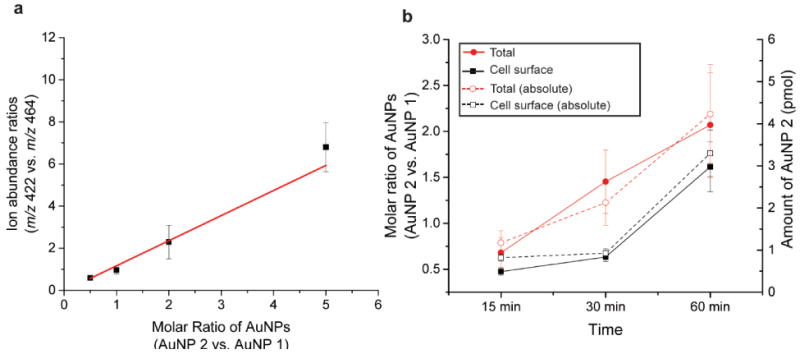
Figure 4.

Quantification of cell surface-bound and total AuNPs in HepG2 cells. (a) Calibration curve obtained for AuNP 2 (m/z 422) when using AuNP 1 (m/z 464) as the internal standard (b) Relative amounts (solid) and absolute amount (pmol) (dashed) of AuNPs absorbed on cell surface and associated with the entire cells. The absolute amount of total AuNP 2 was measured by ICP-MS and the absolute amount of cell surface AuNP 2 was determined using the calibration curve.
