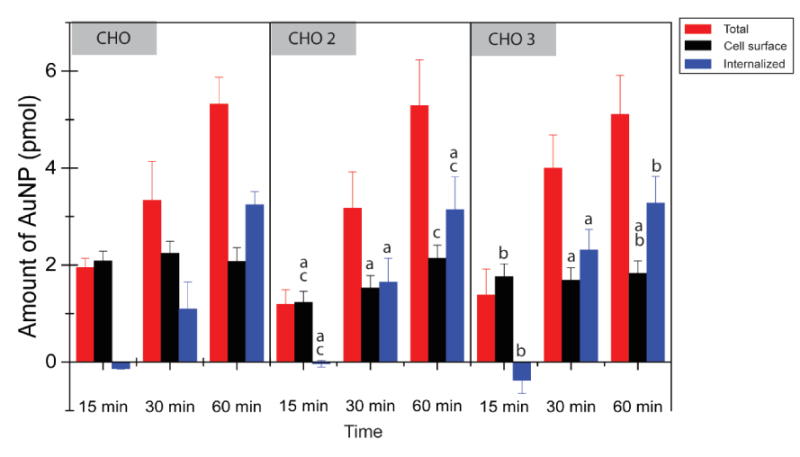
Figure 5.

Quantities of AuNPs associated with the different CHO cell lines. One way-ANOVA (P<0.01) was performed, n=3, all error bars represent standard deviation. Letters above the bars indicate significance, in which a, b and c are in comparison with CHO, CHO2 and CHO3 at the same time point respectively.
