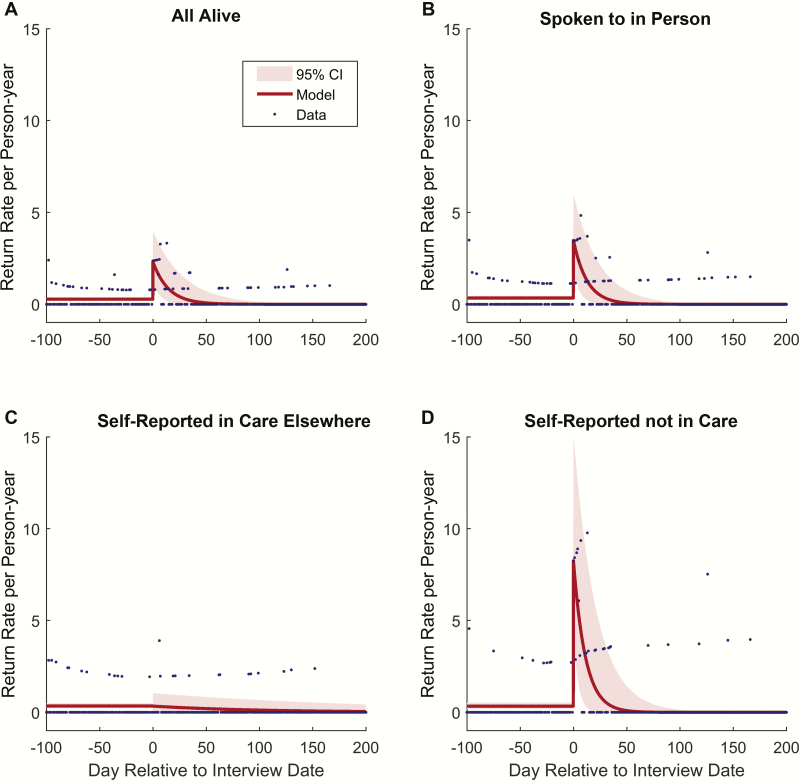
Figure 3.
Half-life of the effect of tracing. Date of return to care on each day of observation, where day zero is the date of tracing, was fit to an exponential decay model using Levenberg-Marquardt nonlinear least squares optimization, with confidence intervals (CIs) generated by bootstrap resampling of traced patients. Model parameters including the half-life of the impact of tracing were estimated for all traced patients (half-life of 7.8 days; 95% CI, 3.4–13.0 days), only those patients interviewed in person (half-life of 7.3 days; 95% CI, 3.4–12.2 days), and the subset of all interviewed patients, including both those who reported being in care or out of care (half-life of 7.0 days; 95% CI, 2.6–12.9 days). No significant trend in return date could be identified for those self-reporting to be in care elsewhere. The effect of tracing appeared to be concentrated in patients self-reporting to be out of care, and had a half-life of approximately 1 week until.

