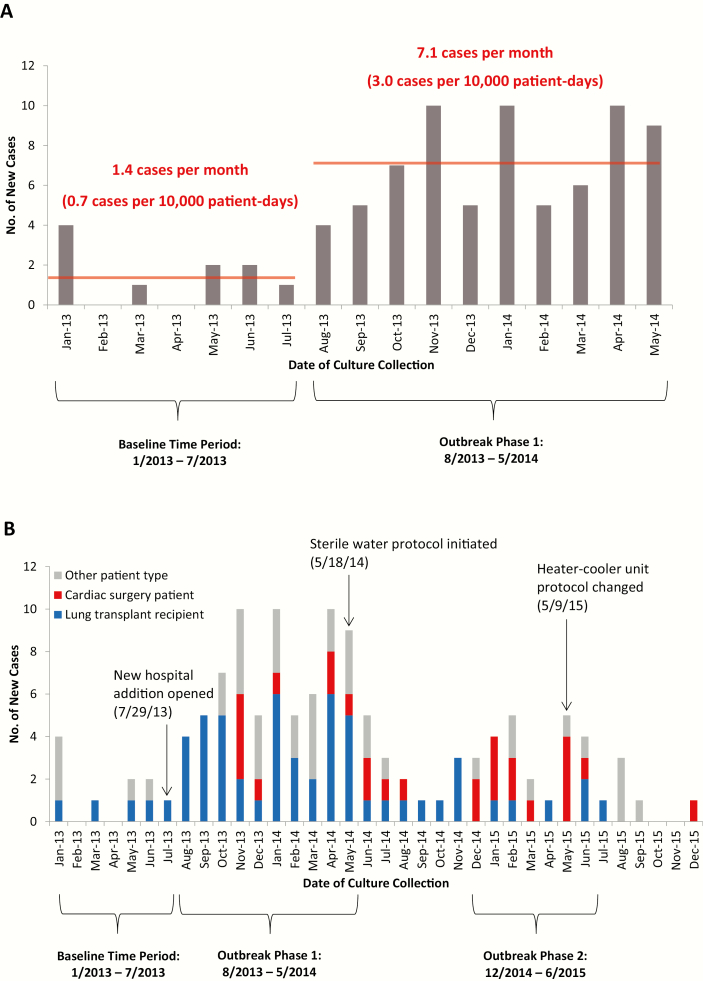
Figure 1.
Epidemic curve of Mycobacterium abscessus colonization or infection. A, Initial epidemic curve including the baseline time period (January 2013–July 2013) and phase 1 of the outbreak (August 2013–May 2014). B, Final epidemic curve portraying key events and incident cases over the full 3-year study period, including phase 2 of the outbreak (December 2014–June 2015). Cases were stratified by patient type. The timeline of both epidemic curves was constructed from dates of culture collection, which in some cases occurred months after date of suspected patient inoculation. In particular, cardiac surgery cases that were identified after the 9 May 2015 heater-cooler unit disinfection protocol changes were either linked to cardiac surgeries performed before these protocol changes (n = 3) or were thought to be unrelated to the cardiac surgery (n = 1).

