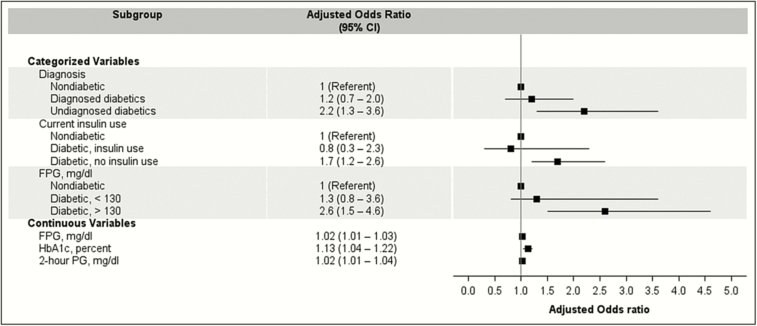
Figure 3.
Adjusted logistic regression analysis of tuberculosis infection after stratification by several survey- and laboratory-based proxies of diabetes severity. Data are weighted odds ratios with 95% confidence intervals. Adjusted odds ratios for continuous variables are shown per unit increase (1-mg/dL increase in FPG or PG and for every 1% increase of HbA1C). Diabetic participants were classified as “diagnosed” if they self-reported having been previously diagnosed by a physician or health professional. Undiagnosed diabetics were classified as those who reported not previously been diagnosed with diabetes but had a HbA1C ≥6.5%, an FPG ≥126 mg/dL, or PG ≥200 mg/dL test result. Prediabetics are not shown for categorized variables. Each model is adjusted for participant age, gender, birthplace (United States or foreign born), and smoking status. Abbreviations: CI, confidence interval; HbA1c, hemoglobin A1c; FPG, fasting plasma glucose; PG, 2-hour plasma glucose.

