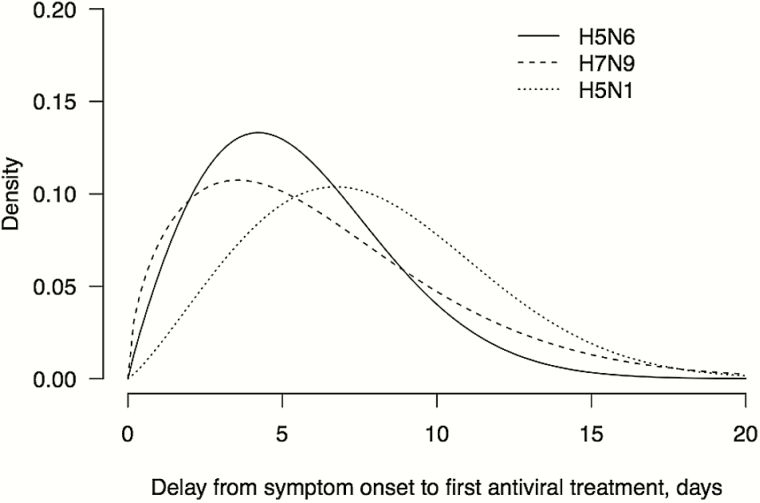
Figure 3.
Days from illness onset to the initiation of antiviral treatment for laboratory-confirmed cases of human infection with highly pathogenic avian influenza A(H5N6) (solid lines), low pathogenic avian influenza A(H7N9) (dotted lines), and highly pathogenic avian influenza A(H5N1) (dashed lines) viruses in mainland China. The curves are constructed as smoothed versions of the histograms from the raw data.

